Risk/Reward Rating: Negative
GoodRx Holdings, Inc. (NASDAQ: GDRX) continues to report excellent revenue performance through the first half of 2021 with growth of 31% compared to the first half of 2020. Since its founding in 2011, the company has successfully built a leading brand within the prescription drug market among consumers, healthcare providers, and drug manufacturers. The brand equity to date has been built on enabling consumers to afford prescription drugs when insurance is not sufficient to cover the price or when consumers lack insurance coverage altogether. In essence, the GoodRx brand penetrated the marketplace under the company’s original mission: “to help Americans get the healthcare they need at a price they can afford.”
Business Model Shift
Since the company’s IPO on September 23, 2020, GoodRx has been executing a material shift in its mission and business model. In addition to the original affordability-focused mission statement, the company has added and is now implementing the following vision: “We are building the leading, consumer-focused digital healthcare platform in the United States.”
The business model shift is from a narrow prescription drug pricing value proposition to a more holistic subscription and fee-based digital healthcare platform integrating consumers, healthcare providers, and drug manufacturers. The platform encompasses not just pricing alternatives but information and service delivery. It is a bold strategy that carries a heightened level of execution risk and, if successful, offers a much larger reward for GoodRx shareholders over the long term.
The prescription drug transaction market in the United States is an enormous addressable market opportunity. GoodRx is now adding the massive healthcare service provider sector and drug manufacturer marketing and distribution opportunity to its total addressable market. GoodRx will face stiff competition for its broadening platform approach. The enormity of the opportunity is coveted by most industry players and increasingly by technology-focused entrants such as Amazon (NASDAQ: AMZN), who is the ultimate competitor.
To build the case for GoodRx given the transformation taking place, we must first understand how the company arrived at this juncture and the trajectory it is currently on.
Business Segments
GoodRx reports its revenue in three business segments: prescription transaction revenue (monthly active consumers), subscription revenue (subscribers), and other (primarily pharma manufacturer solutions and to a lesser degree telehealth). The following table was compiled from the company’s recent Q2 2021 10-Q filed with the SEC.
The prescription drug transaction business accounted for 82% of total revenue in Q2 of 2021 and is trending lower (highlighted in yellow). This segment accounted for 89% of revenue in 2020 and 94% of revenue in 2019. On the Q2 earnings conference call, management indicated that this segment will trend under 80% in Q3 of 2021. This trajectory is in line with the business model change discussed above.
During the Q2 conference call, management stated that the subscription model is priced aggressively such that most new consumers will find it economically beneficial to join the GoodRx monthly subscription platform rather than to use GoodRx’s services on a per prescription transaction basis (the historical business model). Furthermore, management indicated that the subscription pricing model makes it attractive for existing monthly active consumers to shift from paying per prescription transaction to paying a monthly subscription fee.
Pricing Models: Subscription vs. Transaction
If existing consumers shift to subscription payments rather than transaction-only payments, GoodRx will experience a seismic shift in its revenue mix creating both risks and potential rewards. The following table was compiled from GoodRx’s Q2 2021 10-Q and presents the average revenue per user under each of these revenue models for the first two quarters of 2021. Segment revenue for the quarter is divided by the number of customers under each option as reported in the 10-Q.
While the calculation is simplified and not an exact measurement of the economics of the two pricing models (this level of detail is not provided by the company), it captures the underlying shift between the two and highlights the business risk. Revenue per prescription transaction consumer (MAC) was 86% higher in Q2 2021 and 60% higher in Q1 of 2021 than revenue from subscription customers. This is a clear risk to near-term revenue growth for GoodRx. The long-term upside to this model is that GoodRx locks in predictable monthly revenue with subscriptions and should be able to add incremental fees for content, services, and possibly many of the drugs purchased by its subscribers.
Key Performance Indicator
A key performance indicator for GoodRx historically has been its monthly active user count (prescription transaction consumers). This is now joined by its subscriber count in gauging the company’s consumer market penetration going forward. The trend in this combined figure is a critically important performance indicator for GoodRx’s future success. The following table was compiled from the company’s most recent 10-K annual report and the Q2 2021 10-Q filed with the SEC (YOY = year-over-year and MAC = monthly active consumers).
I have highlighted the important trends in yellow. There is a material slowdown taking place in GoodRx’s consumer penetration. Growth is trending toward 40% on average the past four quarters in comparison to the 60% growth range in 2018 and 2019. Slowing growth rates are natural, however, the current slowdown is substantial and points toward a heightened risk of disappointing performance in the near term. It will be important to monitor these trends in the coming quarters.
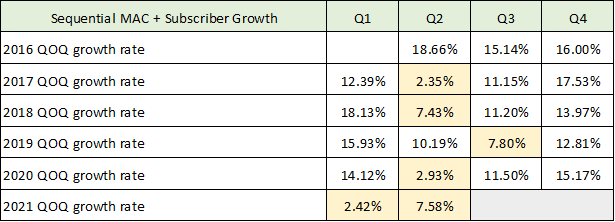
Looking at the sequential quarterly growth (quarter-over-quarter or QOQ) will add more insight into this possible slower growth trajectory. Here I am looking at each quarter’s growth compared to the immediately preceding quarter. The following table was compiled from the company’s most recent 10-K and 10-Q filed with the SEC.
I have highlighted the most important cells pertaining to the recent growth slowdown. Notice that GoodRx often experiences sequential growth slowdowns in Q2 of each year which suggests some seasonality in the ebbs and flows of the healthcare industry. On the other hand, Q1 of 2021 was unusually weak for GoodRx, which then makes the Q2 2021 7.58% sequential growth weak by historical standards as it is compared to a much weaker Q1 in 2021. What can be said of this data is that a slowdown is taking place through the first half of 2021 which is outside of historical seasonality norms.
Given the potential slowing of the consumer growth trajectory detailed above, the trends in GoodRx’s financial performance and fundamentals, as well as the valuation of the company take on added significance for prospective investors. In the case of valuations as they pertain to growth stocks like GoodRx, the greatest moment of risk for investors normally occurs at the inflection point when hypergrowth turns into merely above average growth. At these moments, extreme valuations are often in place as investors extrapolate recent hypergrowth into the indefinite future.
Financial Performance
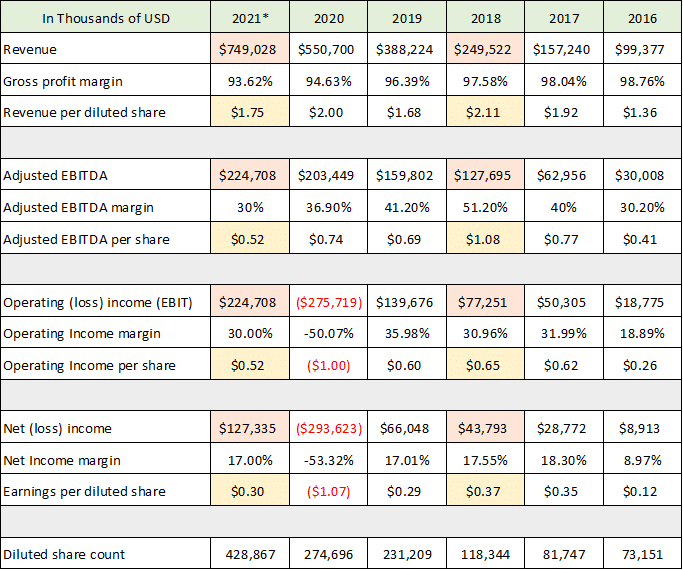
I will review GoodRx’s financial performance from 2016 onward to highlight the business trends before turning to the valuation. The following table was compiled from the 2020 10-K and the Q2 2021 10-Q filed with the SEC.
Please note that I have made several projections for 2021 as the year is only halfway complete (2021* column). The company was unable to provide Q4 2021 guidance due to elevated uncertainties around COVID. GoodRx’s shifting business mix may also be creating forecast challenges. I have used management’s high-end guidance for Q3 of 2021 for revenue and assumed Q4 grows at the same 40% year-over-year rate. I then assume a normalized net income margin of 17% which was the norm from 2017 through 2019, and prior to the IPO and share-based compensation expense distortions. For adjusted EBITDA in 2021, I use management’s 30% ballpark estimate for the business (I carry the 30% assumption to operating income as this was the norm in 2017 and 2018).
In discussing the growth rate of GoodRx, I will focus first on the per share performance metrics highlighted in yellow and then turn to the absolute dollar figures highlighted in orange. Peak per share performance was achieved in 2018. Since this time, the increasing share count (final row) has fully diluted the absolute dollar growth across all business metrics. In other words, since 2018 the share count has grown faster than the business resulting in no benefits on a per share basis. The rapid increase in shares following the IPO in 2020 creates a heightened dilution risk for prospective shareholders. It should be noted that share-based compensation expense is largely responsible for the 2020 operating and net income loss reported.
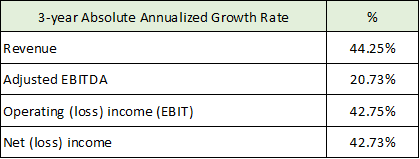
Turning to the absolute dollar growth rate of the business, the performance has been impressive. The following table (created from GoodRx’s most recent 10-K and 10-Q) is the 3-year annualized growth rate across key fundamentals from 2018 through 2021 (including the estimates for the second half of 2021 as discussed above).
On most metrics, it is fair to say that GoodRx is growing at approximately 40% currently (and in the recent past). This also happens to be management’s estimate for Q3 of 2021 as well as my own estimate for the final half of 2021. The adjusted EBITDA margin was unusually high in 2018 and caused some outlier effects, registering only 20% growth. The share count dilution mentioned above should slow going forward allowing more of the business growth to filter through to shareholders.
Valuation
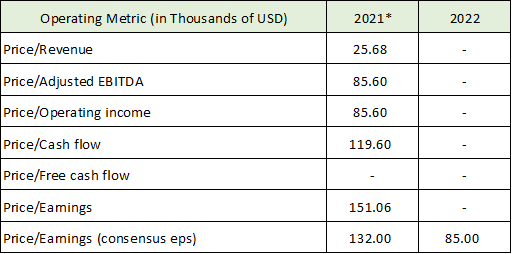
While the 40% growth rate supports a vibrant valuation, the slowing consumer adoption trends and heavy shareholder dilution place a heightened importance on the valuation of GoodRx for prospective investors. In the following table I summarize the current valuation situation. The fundamental data is drawn from the 2021* column in the financial performance section above (except for cash flow data which will be discussed below and consensus eps estimates from CNBC.com in the final row).
On each metric, the valuation is extreme from a historical market perspective. The valuation is also extreme relative to current market averages which range from 22x earnings to 32x earnings (S&P 500: 22x, Nasdaq: 100 29x, Russell 2000: 32x). When the elevated valuation is combined with the budding signs of a slowdown in consumer adoption, a heightened risk of multiple compression exists (lower valuation multiples).
Putting the elevated risk of a valuation correction aside, the most pressing issue for GoodRx is the long-term growth outlook given the current market trends and the company’s business model shift. Before wrapping things up it is important to visit the cash flow statement as it highlights the trends and illuminates GoodRx’s capital investment choices which are all important for its future growth rate.
Capital Allocation: Cash Flow Statement
GoodRx’s business model shift is further evidenced in its cash flow statement. The following table is compiled from the company’s most recent 10-K and 10-Q. In respect to the 2021* column, the acquisitions are actual acquisitions through July 7, 2021. All other inputs in this column, except free cash flow, are two times the actual first half of 2021 results.
The most important row is highlighted in yellow and reflects the capital allocation decisions of GoodRx and the business model shift. The company is increasingly turning to acquisitions in recent times to build its new platform business model and acquire competitors in the discount prescription drug transaction sector.
In the above table I treat acquisitions like one would treat capital expenditures in calculating free cash flow (subtraction from cash flow from operations). The reason for this is that each of the acquisitions was not material to GoodRx’s financial results (thus, their results are not broken out). Essentially, the acquisitions are a form of capital expenditure for future revenue production rather than an addition to the current revenue run rate. I treat capitalized software the same as the company is spending increasing amounts on software to become a digital healthcare platform (leaving aside whether they should be capitalized rather than expensed).
Growing through acquisitions creates a heightened level of business execution risk as acquisitions are often difficult and costly to integrate into the existing corporate culture and infrastructure. Furthermore, the purchases are not adding materially to GoodRx’s near term results which pushes the potential return on investment into the uncertain future. Due to the lack of material revenue contribution near term, the increased costs and associated productivity loss from the acquisitions will likely drag on profitability at a time when consumer adoption growth appears to be slowing. This could be a cocktail for disappointing growth and profitability for GoodRx in the coming year.
Given GoodRx’s excellent historic revenue growth performance and the positive secular growth outlook for its target markets, it is helpful to place the above fundamental analysis into the context of price action in order to get a sense for accumulation levels that would offer greater opportunity to prospective investors.
Technicals
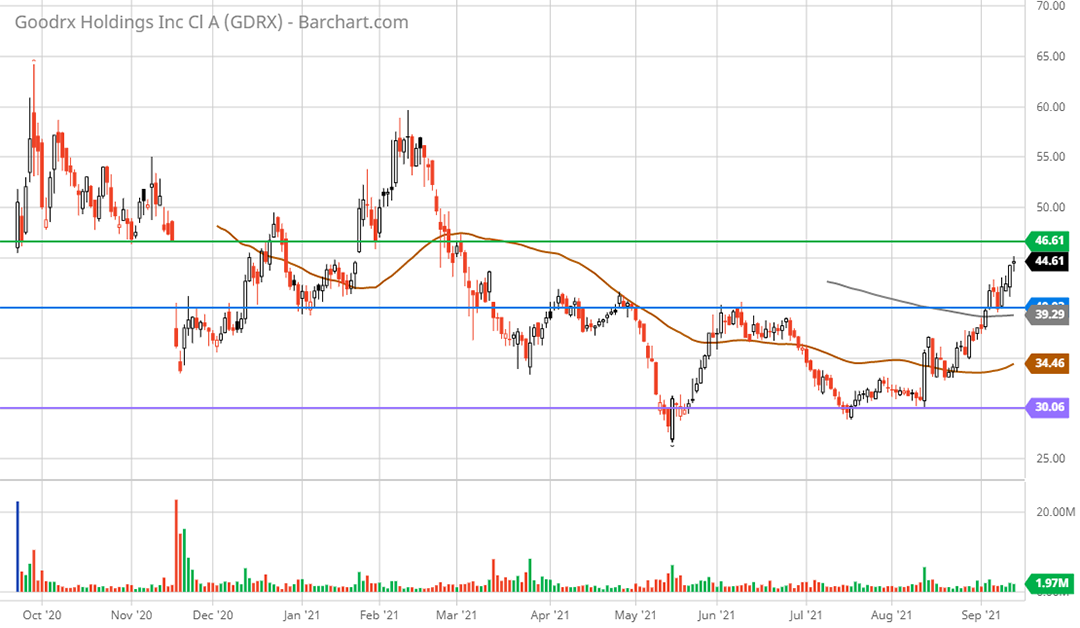
Technical backdrop: GoodRx came public in September of 2020 near $46. Ever since, the stock has been in a large sideways to downward sloping trend. The stock reached a low near $26 in May of 2021. The technical setup for the stock is well defined by three key support and resistance levels. These key levels are represented by the colored horizontal lines on the 1-year daily chart below.
The stock is approaching what should be heavy resistance near $47 (green line). This was the IPO price level and where the gap lower occurred in November of 2020. The valuation reality supports this being heavy resistance. Below the current price, there is a support zone near $40 (blue line), which had been resistance from March of 2021 through June of 2021. This should be tenuous support given the valuation conditions.
The final support line near $30 (purple line) looks to offer the first possible accumulation zone. This is near all-time lows leaving little visibility beneath this level. It should be noted that GoodRx would still be trading at 17x estimated 2021 sales at $30. As a result, a test materially beneath the $30 support level is on the table and may offer investors an entry point with more meaningful opportunity.
Summary
GoodRx is an excellent founder-led company with a demonstrated ability to grow a brand in the prescription drug market across consumers, healthcare providers, and drug manufacturers. Adding to the investment case is the company’s proven ability to translate its brand-building expertise into sustained revenue growth and a profitable business model. The upside allure is enhanced by the company’s bold vision of becoming the leading consumer-focused digital health platform in the United States. The total addressable market opportunity is extraordinary if GoodRx can successfully become a dominant platform in the healthcare market. For these reasons, GoodRx should be on the watchlist of all growth-oriented investors.
That said, at the current share price, the risks outweigh the rewards. The primary concern in the near term is the extreme valuation at the current price. This creates extraordinary risk for prospective investors. Adding a major business model shift to the elevated valuation levels substantially increases the risk level near term. In fact, this compounding of risk opens the door not just to valuation multiple compression but to the possibility of execution missteps and growth deceleration which would amplify the multiple compression as growth assumptions would contract in concert. A substantial share price decline that provides a greater margin for error could create an attractive opportunity for high-risk, high-reward investors long term assuming the business transformation progresses smoothly.
Price as of this report 9-14-21: $44.85


