Risk/Reward Rating: Positive
Flex is a global technology, supply chain, and manufacturing solutions company. The company is the manufacturer and critical supply chain partner to many of today’s leading brands. For example, the most successful semiconductor company of recent years, NVIDIA, relies on Flex for many of its products. The recent COVID supply chain disruptions have brought the value of world-class supply chain partners into focus and Flex qualifies as such. The current valuation of Flex stock does not reflect this value proposition.
The stock is currently valued at just 11x fiscal 2021 earnings (year ended 3-31-21) and 10x expected fiscal 2022 earnings estimates. On a price to revenue basis, Flex trades at a mere 0.36x last year’s sales. While manufacturing firms historically trade at lower multiples, these levels seem extreme in today’s hyper-valued markets which are at record valuation levels.
On the business front, Flex has built a network of over 100 locations in 30 countries on four continents. The company has global scale and an extensive network of innovation labs, design centers, and manufacturing and services sites in the world’s major markets (Asia, the Americas, and Europe). It delivers a competitive advantage to customers by providing leading-edge manufacturing technology, supply chain expertise, improved product quality, increased flexibility, and faster time to market.
Flex is a play on diversified global GDP growth with a tilt toward secular growth industries. For example, the company serves the following broad industry categories: automotive, healthcare, industrials, computers and electronic equipment, lifestyle products, and consumer devices. In addition to this broad growth sector exposure, the company has been transitioning its business mix toward higher margin product lines including digital healthcare, electric and autonomous vehicles, clean energy, connectivity, and next generation robotics. The company’s focus on complex, engineering-led sub-sectors should provide Flex with a competitive advantage in these secular growth industries.
In a macro environment that is likely to favor value stocks after the longest stretch of growth stock outperformance in history, the 10x earnings valuation offers ample room for multiple expansion. When combined with exposure to secular growth markets, the above average growth and opportunity for sizeable valuation multiple expansion could create an explosive environment for the stock price.
It should be noted that Flex has a healthy balance sheet with historically high cash levels and is rated investment grade by S&P and Moody’s. The company has $316 million remaining on its share buyback authorization which should provide further support to the price. Finally, the company has filed to IPO its Nextracker subsidiary which provides solar energy automation and efficiency solutions which would add additional optionality to Flex if it is completed.
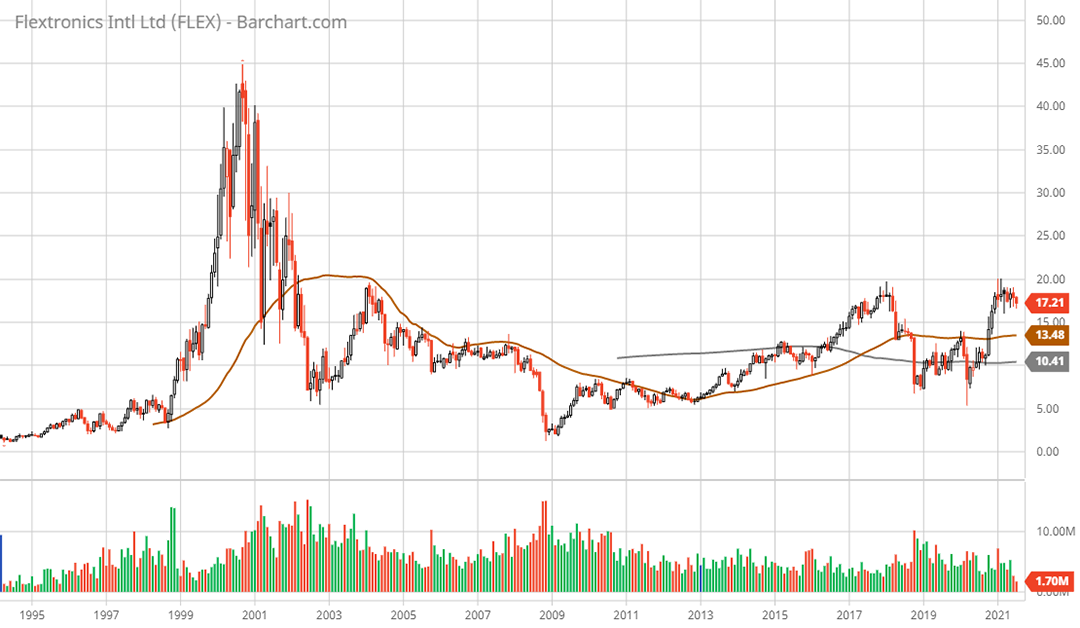
Technical backdrop: Flex became a highflyer at the tail end of the dotcom bubble in the late 90’s. At the time, the computer and networking infrastructure markets were exploding and were large customers of Flex. The resulting parabolic price move from $5 to $45 can be seen in the Flex max. monthly chart. Since the dotcom crash, Flex has built a broad 20-year base with features that resemble a cup and handle and inverse head and shoulders bottom. Since 2018 a smaller cup and handle structure has formed. When combined with the valuation, this strong basing action should provide a solid support foundation.
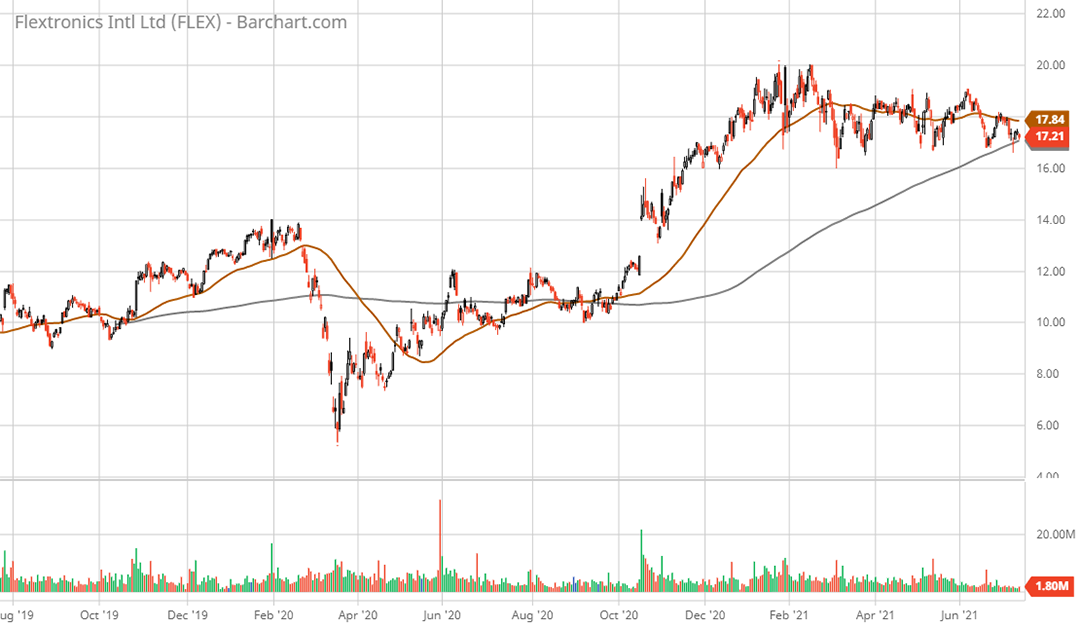
In the short term, the sideways price movement in 2021 is a healthy consolidation pattern of recent gains. With the price sitting on the 200-day moving average (grey line on the 2-year daily chart), the probability of an upside breakout looks good.
Technical resistance: $20 which is near current levels and is the high for the long basing pattern.
Technical support: The current level which is also the 200-day moving average (grey line on the 2-year daily chart). Next lower support is $14 which was the pre-COVID crash high and the breakout area in the fourth quarter of 2020.
Price as of report date 7-14-21: $17.21
Flex Investor Relations Website: Flex Investor Relations
All data in this report is compiled from the Flex investor relations website and SEC filings, and where applicable publicly available information regarding consensus earnings estimates.


