I am assigning Etsy, Inc. (NASDAQ:ETSY) a negative risk/reward rating based on its sizeable profit margin contraction, rapidly decelerating revenue growth, an elevated risk of underperforming expectations, and questionable capital allocation choices. It remains to be seen whether Etsy can reignite and sustain the dynamic growth it experienced during the COVID lockdowns.
The platform nature of Etsy’s business model creates a potential long-term opportunity as was evidenced by its 28% operating profit and 74% gross profit margins in recent times. In this article I review the Etsy investment case across key performance metrics with an eye toward identifying key business trends that will impact the future. This framework will then serve as a foundation to form an investment strategy for the shares.
Risk/Reward Rating: Negative
Etsy reported a 25% operating income decline for Q2 2021 on August 4, 2021, sending the shares down 13% the following day. The shares have since recouped the losses, however, the inability to rally suggests that investors are concerned. Market participants may be starting to reconsider their growth expectations for Etsy given the scale of its profitability decline and sales slowdown.
Margin Contraction
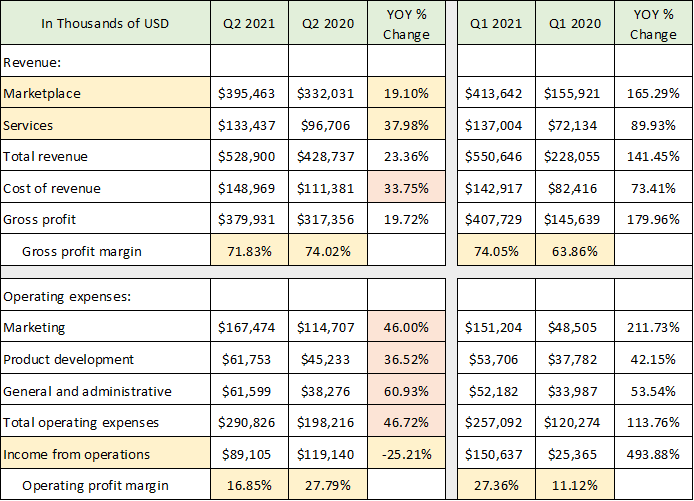
The extensive margin contraction that is unfolding remains the primary concern as it raises questions about the sustainability of the Etsy business model. The following table breaks down the drivers of the margin contraction and was compiled from Etsy’s Q2 10-Q filed with the SEC (YOY = year-over-year).
Source: Created by Brian Kapp, stoxdox
The orange shaded cells highlight the broad-based nature of the company’s increasing cost structure (YOY % Change column). Cost of revenue grew at a 50% higher rate than revenue in Q2 2021 at 34%, leading to a material gross profit margin contraction. Gross profit margin looks to have peaked in Q1 2021. Operating expenses are the largest red flag for the Etsy investment case. They are growing at twice the rate of revenue coming in at 47% compared to 23% revenue growth (final orange highlighted cell). The extraordinary cost increases drove the company’s operating profit margin down to 17% in Q2 2021 from 28% in Q2 2020 (final yellow shaded row).
The extreme margin volatility raises fundamental questions about Etsy’s business model and its sustainable profit margin potential. The 17% operating profit margin in Q2 2021 is trending backward to the 11% margin posted in Q1 2020, which was prior to Etsy’s COVID-induced business boom (final highlighted row). If the 11% operating profit margin is closer to the business model’s sustainable potential rather than the 27%-28% posted during COVID, earnings estimates for Etsy for the coming years may be materially too high. This then sets the stage for large disappointments and heightened volatility.
Another surprising feature of the declining margin trend relates to the revenue mix by reporting segment (first two rows in the table). Etsy reports revenue in two segments: marketplace and services. Marketplace revenue is the company’s core business and is tied to the volume of goods sold across Etsy’s platforms. Services revenue is primarily composed of advertising and services revenue from Etsy sellers trying to broaden their reach in the marketplace.
It stands to reason that services revenue will follow marketplace revenue. If platform volumes are growing rapidly, sellers will have greater incentive to invest in advertising and other services in order to capture the increasing market opportunity. One would expect services revenue to offer higher profit margins than marketplace revenue.
Services revenue should represent marginal dollars on top of the preexisting cost base. Advertising and service delivery should be largely automated and leverage the existing technology infrastructure. As a result, Etsy’s rapid service revenue growth (38%) in Q2 2021 compared to marketplace revenue growth (19%) should have materially expanded gross profit and operating profit margins. The material margin contraction in this light is concerning and raises questions about the profitability of the business model going forward.
Profitability Measures
The margin contraction in Q2 2021 is most apparent in Etsy’s cash flow from operations. The following table was compiled from Etsy’s Q2 10-Q filed with the SEC. It breaks out several profitability measures to provide more color to the operating income contraction discussed above.
Source: Created by Brian Kapp, stoxdox
Etsy’s cash flow from operations (yellow highlighted row) plunged by 45% compared to Q2 2020 and declined substantially from Q1 2021. Q2 2020 was a blowout quarter for Etsy as the COVID lockdowns sent consumers online in mass, creating a difficult comparison for Q2 2021. That being said, revenue grew by 23% compared to Q2 2020 which should have translated into healthy cash flow growth rather than a massive decline. Cash flow from operations validates the 25% operating income decline in Q2 2021. In addition, it may point toward this operating profit trend deteriorating further in the quarters to come.
Net income registered growth of 1.9%. However, this was a function of greatly reduced interest expense and a massive $38 million tax swing in Etsy’s favor. Each of these benefits have one-time effects and are not recurring features of the company’s continuing operations. This renders the 25% operating income decline more indicative of the underlying business trends than net income.
The company does provide an adjusted EBITDA profitability measure and issues forward profitability guidance using this metric. The decline in this regard was a less extreme 7.4%, in comparison to the operating profit decline of 25% and the cash flow decline of 45%. The large discrepancy in this measure suggests treating it with caution in gauging Etsy’s underlying business economics as adjusted EBITDA excludes many actual expenses. Etsy provides forward guidance to the investment community using adjusted EBITDA. As a result, it is a primary forward-looking measure and is useful in gauging the underlying direction of operating income and cash flow from operations.
Guidance
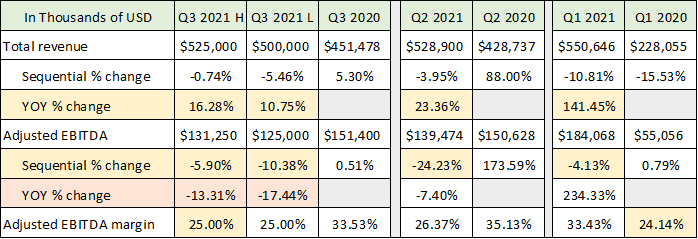
Etsy provided guidance for Q3 2021 but was unable to offer a projection for Q4 given the limited visibility in its business. The guidance for Q3 provides excellent color for the sales and profitability trends discussed above. The following table was compiled from Etsy’s 8-K Q2 earnings release and Q2 10-Q filed with the SEC. The first two data columns contain the company’s high and low guidance for Q3 2021 and are compared to Q3 2020. I have provided the actual results from Q2 and Q1 of 2020 and 2021 to illustrate the business trends.
Source: Created by Brian Kapp, stoxdox
As mentioned at the end of the Profitability Measures section, Etsy’s adjusted EBITDA figure is best used as a directional profitability gauge (trend) rather than a measure of absolute profitability. Recall from above that adjusted EBITDA declined 7.4% in Q2 2021, while operating income declined 25% and cash flow from operations declined 45%. The company is forecasting an adjusted EBITDA decline of 13% to 17% YOY (orange highlighted cells) in Q3 2021. This would mark the third straight quarter of sequential declines (quarter-over-quarter). It is unclear what this 13% to 17% adjusted EBITDA decline will translate into in terms of operating income and cash flow. History suggests that they will decline more than adjusted EBITDA.
On the revenue front, Etsy is projecting YOY growth of 11% to 16% (first yellow highlighted row). This raises further concerns regarding the guidance for a substantial decrease in profitability. The adjusted EBITDA margin (final row shaded in yellow) is projected to contract to 25% which is similar to the Q1 2020 margin of 24%. This suggests the pre-COVID profit margins of Etsy’s business model may be more indicative of its sustainable economics. Recall that the operating profit margin was 17% in Q2 2021, which was down from 28% in Q2 2020 and is trending toward the 11% posted in Q1 2020 pre-COVID.
Consensus Estimates
The company was unable to provide guidance for Q4 2021. However, we can utilize the trends discussed here and the guidance for Q3 2021 as a framework to view consensus analyst estimates for the remainder of 2021 and on through the next several years. The data in the following two tables is compiled from Seeking Alpha and displays analyst estimates for revenue and earnings per share for Etsy.
Source: Seeking Alpha. Created by Brian Kapp, stoxdox
The revenue estimate of $2.28 billion for 2021 suggests Q4 2021 revenue in the range of $675 million, which would be an increase of 9.4% compared to Q4 2020. This is in line with the low end of the company’s guidance for Q3 2021 revenue growth of 11% YOY. However, the Q4 consensus revenue estimate would imply 29% sequential growth compared to the high end of the company’s Q3 2021 revenue guidance of $525 million. Given the sequential declines throughout 2021 and the rapidly decelerating YOY growth, the Q4 estimates appear to be at risk.
Similarly, entering 2022 with high single digit YOY revenue growth that is in a downward trajectory raises a red flag when looking at the 2022 and 2023 revenue growth estimates (yellow shaded rows). Each of these estimates appears to be at substantial risk of disappointment as Etsy will need to materially reignite growth to achieve these numbers.
The primary business concern of declining profit margins discussed here takes on new meaning when looking at consensus earnings estimates in the following table.
Source: Seeking Alpha. Created by Brian Kapp, stoxdox
Etsy is in its second straight quarter of materially declining profits year-over-year in Q3 2021. With profit margins declining materially and sales slowing to high single digit growth rates exiting 2021, the 18% and 29% earnings growth expectations for 2022 and 2023 appear to be at substantial risk. In fact, it is possible that the company could post flat to negative earnings growth in 2022. This would place the elevated valuation in a new light.
Valuation
Using the above consensus estimate tables, Etsy is trading at 11x estimated sales for 2021. This is extreme in a historical market context and especially so given the expected low single digit growth rate exiting 2021. Turning to earnings, the valuation looks less extreme at 55x the 2021 consensus earnings estimate. While this is well above the market averages at 22x to 32x 2021 earnings estimates (S&P 500: 22x, Nasdaq 100: 29x, and Russell 2000: 32x), it could be appropriate if earnings are growing at above average rates. As discussed in detail here, earnings turned lower in Q2 2021 and look set to continue downward in Q3 2021. With the trend toward continued margin contraction, Etsy may be in a contracting earnings trend which would render the 55x 2021 earnings estimate extremely high.
Business Summary: Unit Economics
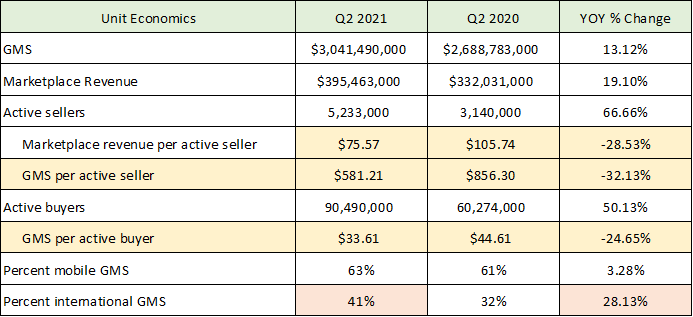
It is important to discern the root cause of Etsy’s margin contraction as the sustainable profit margins of its business model will largely dictate its valuation premium potential in the future. Recall that it was surprising that margins contracted so much alongside surging service sales. The following table was compiled from Etsy’s Q2 2021 10-Q filed with the SEC (GMS = Gross Merchandise Sales).
Source: Created by Brian Kapp, stoxdox
The table focuses on the core marketplace revenue. I have highlighted the trends that are most likely feeding into the margin contraction of the business. The gross marketplace sales volume decelerated much more rapidly than revenue, registering 13% growth compared to 19% revenue growth. Given that gross merchandise sales drive the Etsy business model, this deceleration looks to be placing some pressure on Etsy’s take rate on its seller’s gross sales volumes. Sellers are likely to push back on price increases and ask for greater service in a slowing sales environment.
Looking at the gross merchandise sales per active seller (second yellow highlighted row), average sales per seller collapsed 32% to $581 in Q2 2021 compared to Q2 2020. Etsy’s marketplace revenue per seller declined a similar 29%. Although there was 66% growth in active sellers, Etsy’s margins are being heavily pressured by the greatly reduced seller unit economics. Many of the costs to support a seller are likely fixed. As a result, less productive sellers (lower sales) appear to be placing incredible pressure on Etsy’s profit margins.
The sales per seller metric improves materially as sellers remain active on the platform over many years. This points toward the potential for stabilizing profit margins in the future. The following table provides data for this trend and was compiled from Etsy’s 2020 10-K filed with the SEC.
Source: Created by Brian Kapp, stoxdox
For example, 42.5% of active sellers as of December 31, 2017, continued to be active sellers through their fourth year on the Etsy platform. Sales per continued active seller is trending higher each year for each seller cohort (the year the seller started on the Etsy platform). Given the average gross sales per seller in Q2 2021 was only $581, this points toward increasing margin potential for Etsy if it can retain sellers and enable growth in their sales volumes. However, as of December 31, 2020, only 18.4% of active sellers have been selling on Etsy for more than four years. The 66% increase in active sellers over the past year suggests that profit margins are likely to continue to trend lower as less productive sellers will dominate the platform for some time.
Finally, international sales are growing rapidly at 28% (last row highlighted in orange in the previous table) and now comprise 41% of total marketplace gross merchandise sales. The increasing shift to international markets is likely placing meaningful pressure on profit margins as well. They require incremental investment in selling, general, and administrative expenses as each geographic market is unique and has its own investment requirements. This mix shift would then have the effect of reducing Etsy’s overall operating leverage.
Capital Allocation: Balance Sheet Risk
The material slowdown in sales and profitability places Etsy’s recent acquisition activity under the microscope. The company announced the acquisition of Depop Limited in Q2 2021 for $1.625 billion in cash, valuing the company at an incredible 23x 2020 sales. Depop is an online marketplace for used clothing that caters to Gen-Z consumers.
Depop generated $70 million of sales in 2020. Sales were likely inflated by the COVID lockdowns and the heavy economic toll on younger workers. Paying 23x sales for a retail clothing marketplace with questionable long-term prospects and the possibility of inflated revenues (due to COVID) is worrisome. The huge premium to sales is extraordinary compared to historical sales multiple valuations for clothing retailers which regularly fluctuate around 1x sales. The platform nature of Depop likely raises the appropriate sales multiple somewhat above a pure clothing retailer. However, it is a platform for used clothing which is an untested and questionable market at scale.
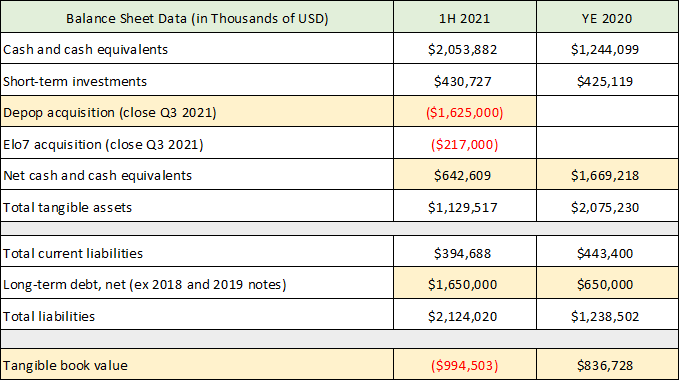
The Depop acquisition is a major red flag and suggests that Etsy is willing to pay a huge premium for revenue growth. This would be unlikely if organic growth visibility were strong. If Etsy had visibility and confidence in its organic growth potential, the $1.625 billion of cash paid for Depop would have been much more productively invested internally in organic growth. To pay for the acquisition, Etsy has taken on a material increase in its balance sheet risk as can be seen in the following table compiled from its Q2 2021 10-Q filed with the SEC.
Source: Created by Brian Kapp, stoxdox
I have removed intangible items as well as liabilities that are likely to be converted into shares (pre-2020 convertible debt) while adding negative cash entries for the acquisitions which will close after the end of Q2 2021 (I assume full cash payment for Depop and Elo7). The intent is to understand Etsy’s balance sheet flexibility given the contracting profitability and large cash usage in acquisitions. The final row highlighted in yellow summarizes the situation quite well. Etsy now has a tangible book value of negative $995 million. The stretched balance sheet will constrict its organic growth opportunity set as well as its growth through acquisition opportunity set. This is likely to remain the case until greater visibility is achieved in the sustainable profitability and revenue growth potential of its business model. The following table summarizes Etsy’s convertible debt outstanding and is for informational purposes. $1.65 billion of convertible debt principal remains well out of the money and is treated as pure debt here.
Source: Created by Brian Kapp, stoxdox
Technicals
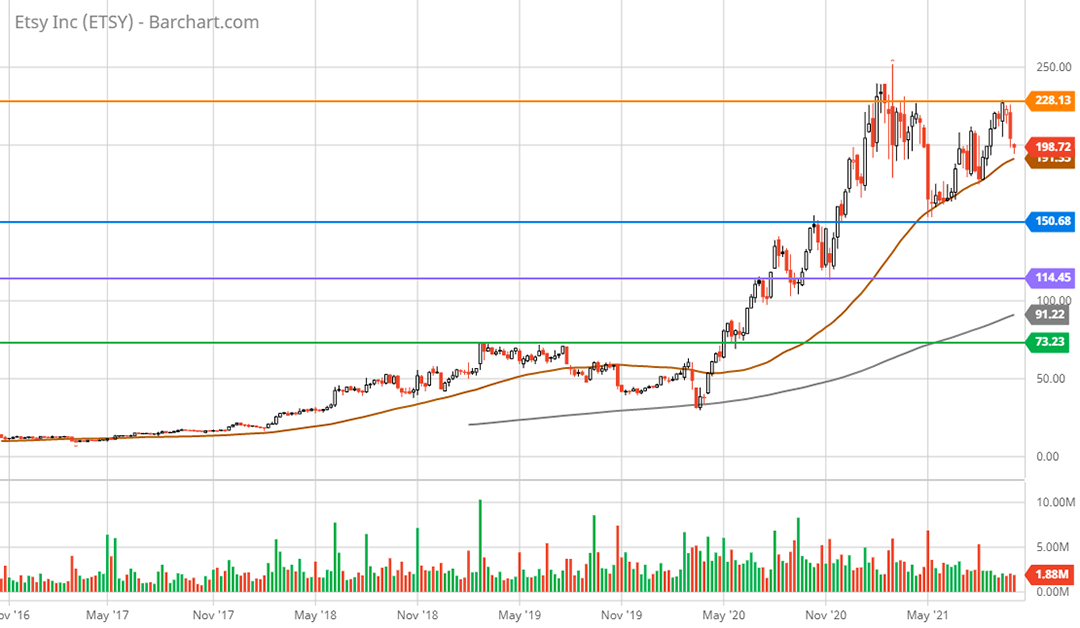
The technical backdrop for Etsy is well defined by four key resistance and support levels as highlighted on the 5-year weekly chart below.
Etsy 5-year weekly chart. Created by Brian Kapp using a chart from Barchart.com
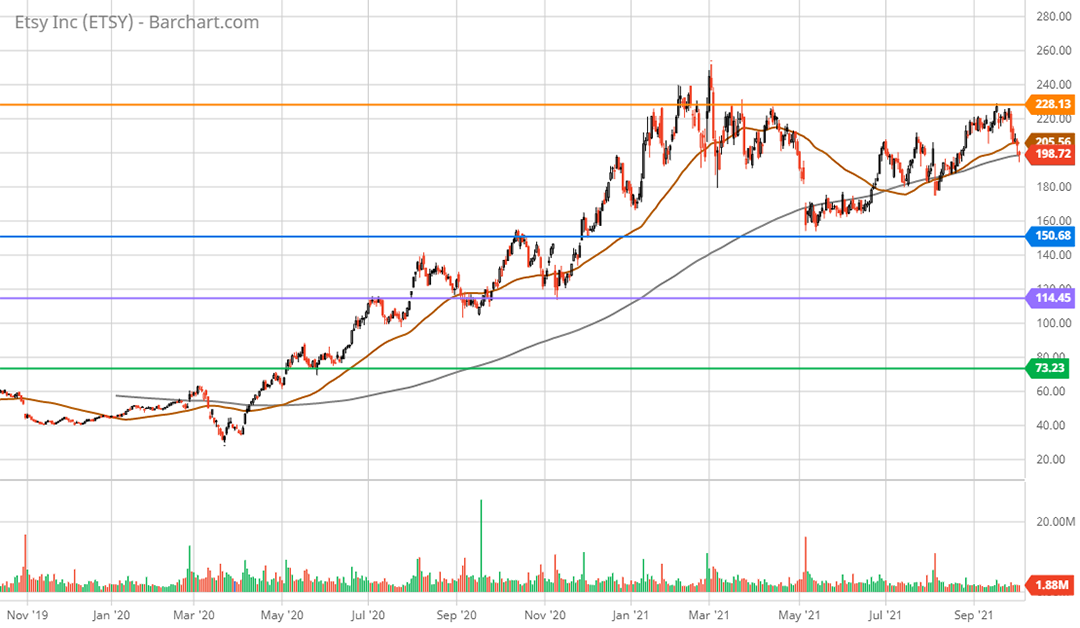
The company is currently carving out a potentially large double top between $228 (orange line) and $250 (the all-time high). Etsy recently was rejected at $228 which sets up a lower high in the double top formation. Based on the negative fundamental trends and elevated valuation, a test of the next lower support level near $150 appears likely (blue line). This was the low reached for the year in May 2021 and was a key resistance zone in Q2 and Q3 of 2020. I have carried the key support and resistance lines over to the 2-year daily chart below for a closer look.
Etsy 2-year daily chart. Created by Brian Kapp using a chart from Barchart.com
The support at the blue line in May 2021 coincided with what looks to be heavy share buyback activity for Etsy (see the tight horizontal trading range from May through June 2021). The company’s existing buyback authorization is likely used up at this stage. This suggests a retest of the blue support zone is likely to be more volatile than the May to June 2021 test. Based on the fundamental analysis here, the area closer to $115 (purple line) looks to be the first attractive entry point for those seeking a long-term growth opportunity. If the recent Depop acquisition turns out to be a bust and profitability does not stabilize, a retest of lower support levels closer to $80 (green line) could be on the table.
Summary
Etsy’s sizeable profit margin contraction, rapidly decelerating revenue growth, elevated risk of underperforming expectations, and questionable capital allocation choices offer more risk than reward at the current valuation. It remains to be seen whether Etsy can reignite and sustain the dynamic growth it experienced during the COVID lockdowns. The platform nature of Etsy’s business model creates a potential long-term growth opportunity that should place the company on the watchlist of all growth investors. Based on the current fundamental and technical backdrop, the shares could provide an attractive entry point beneath the $150 support zone closer to the $115 area.
Price as of report date 10-5-21: $203.64
Etsy Investor Relations Website: Etsy Investor Relations


