Risk/Reward Rating: Positive
EOG Resources is among the highest quality US oil and natural gas producers. The company has a premium asset base across the most prolific shale basins in the United States, with 54% of production volume coming from oil and 46% from natural gas.
In addition to the premium asset base, the company is one of the low-cost producers in the industry with a projected breakeven price of $30 WTI oil. At $36 WTI oil, the company projects it can breakeven while also covering its current dividend payments to shareholders. The premium assets and associated low-cost production provide a competitive advantage through energy price cycles, and a margin of safety for shareholders.
Operations Overview
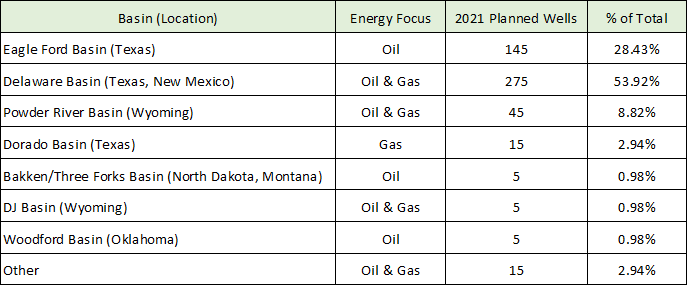
A breakdown of EOG’s 2021 capital budget provides an overview of the resource basins and locations in which the company operates. The following table summarizes the company’s new oil and gas well plans for 2021.
The majority of EOG’s production comes from Texas, a location which supports excellent economics given its highly developed infrastructure and access to the highest priced distribution outlets. Additionally, EOG has access to export markets along the Gulf Coast which enables the company to maximize returns by targeting the highest priced global markets for portions of its production.
It should be noted that EOG has a strong balance sheet with low debt levels further supporting the premium case for the shares. The company has net debt (after subtracting cash) of only $1.245 billion. For comparison, EOG produced $1.6 billion of free cash flow through the first six months of 2021 which provides optionality to pay down the debt if the company chooses to do so. Additionally, EOG has plenty of room for increased debt levels if it finds attractive growth opportunities, however, current plans are to reduce debt levels further over time.
Industry Backdrop
The oil and gas industry globally and in the US in particular is looking better than it has in some time. With global growth returning as the COVID pandemic ends, oil and gas demand should be robust in the coming years. In the US, the prospect of more regional supply chains and the onshoring of industrial and manufacturing activity is likely to create an ideal backdrop for energy demand.
While the shift to electric vehicles will limit oil demand growth long term, it will also limit investment growth in traditional energy markets, setting up a healthy supply and demand balance. In past years, the US energy sector has been plagued by overinvestment which created volatile boom and bust cycles for prices. Going forward, with more stable prices likely, the industry will achieve more attractive returns than in past cycles.
Valuation
EOG is trading at meager valuation levels from a historical perspective, especially when compared to extreme valuation conditions in today’s markets. The company is trading at 8.86x 2021 earnings estimates and 8.4x 2022 earnings estimates. These PE multiples are half of historically normal market-wide multiples, and one-third to one-quarter of prevailing market-wide valuations (depending on the comparison index). Adding to the valuation attraction is a 2.44% base dividend, along with additional special dividends and share repurchases when excess cash builds on the balance sheet.
The high quality of EOG’s asset base, combined with its strong financial position and the improved supply and demand conditions in the oil and gas markets, suggest that such a large discount valuation is unjustified for EOG. If oil and gas prices remain near current levels and trend higher over time, the company’s projected free cash flow could become explosive, opening the door for well above average stock returns.
Technicals
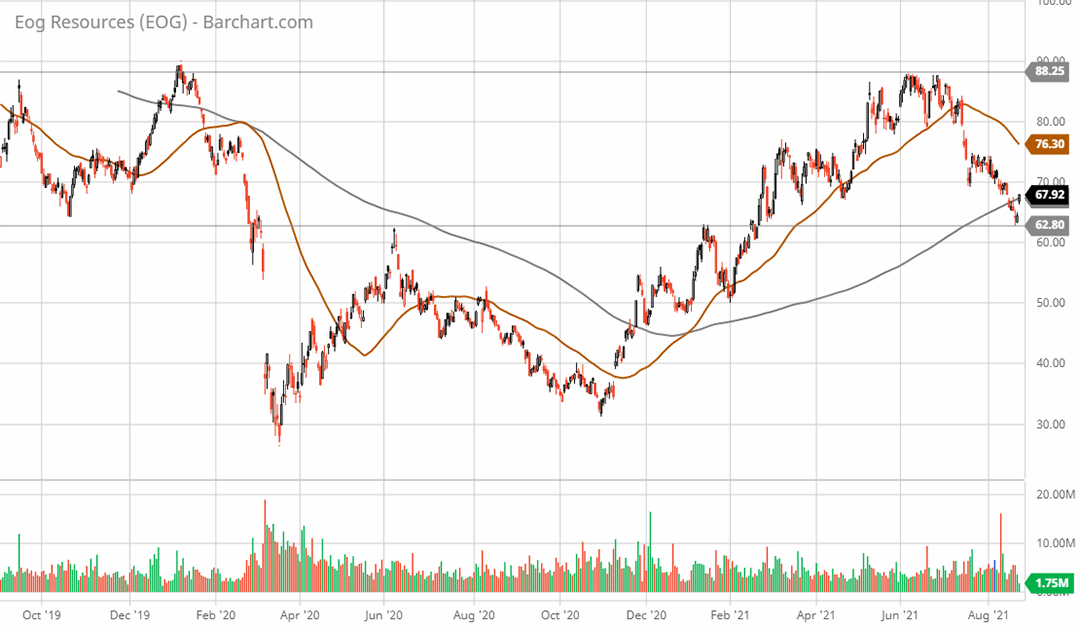
Technical backdrop: EOG Resources has built an incredibly strong technical base on all timeframes (daily, weekly, and monthly). Zooming in to the 2-year daily chart (below), the stock has carved out a large W base which should serve as a solid foundation to support the share price. In fact, the stock is bouncing off support at $62.80 (see the horizontal support line on the daily chart) today with a rally of 5% through midday.
EOG Resources 2-year daily chart
The share price is also breaking back above the 200-day moving average (grey line on the daily chart) at around $67. A bullish read is also provided by the 50-day moving average (brown line on the daily chart) being above the 200-day moving average lending credence to the view of an unfolding uptrend. A move above $88 (upper horizontal trendline on the daily chart) would signal a breakout from the W foundation pattern. The two-year W formation is building a large amount of potential upside energy for EOG stock should the breakout above $88 occur.
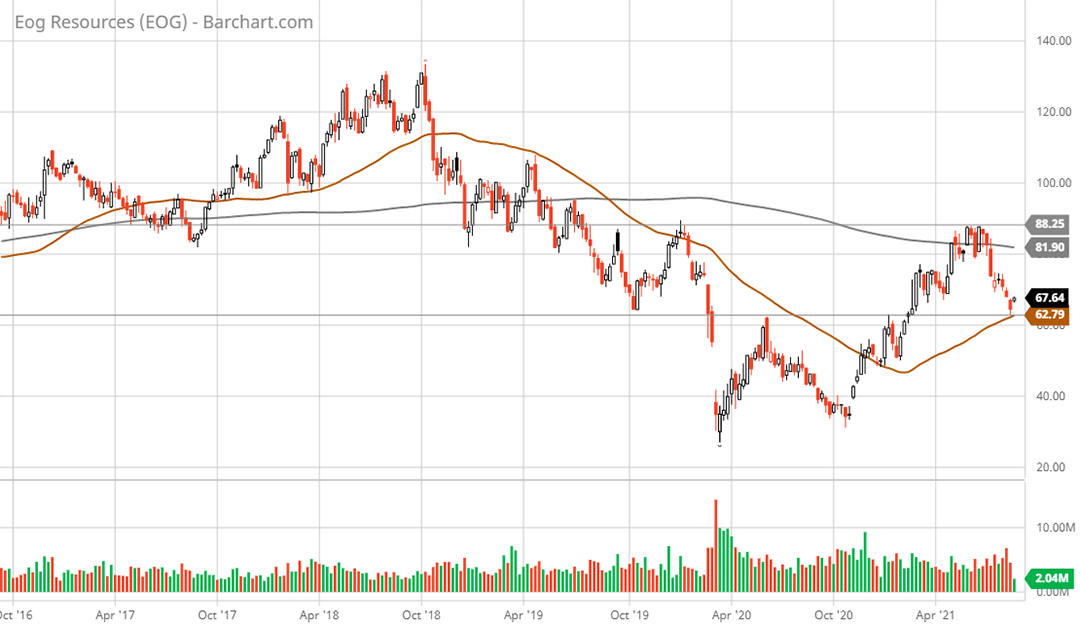
Zooming out to the 5-year weekly chart (below), the W pattern is visible as a large bottoming formation following a two-year bear market from the the peak in 2018 at $133. The stock price is currently bouncing off the 50-week moving average (brown line on the weekly chart). This level should offer solid support going forward. A move above the 200-week moving average (grey line on the weekly chart) would signal that a breakout attempt above the $88 W top is unfolding. If this breakout is successful, next resistance stands at $100, followed by $115, then new all-time highs above $130.
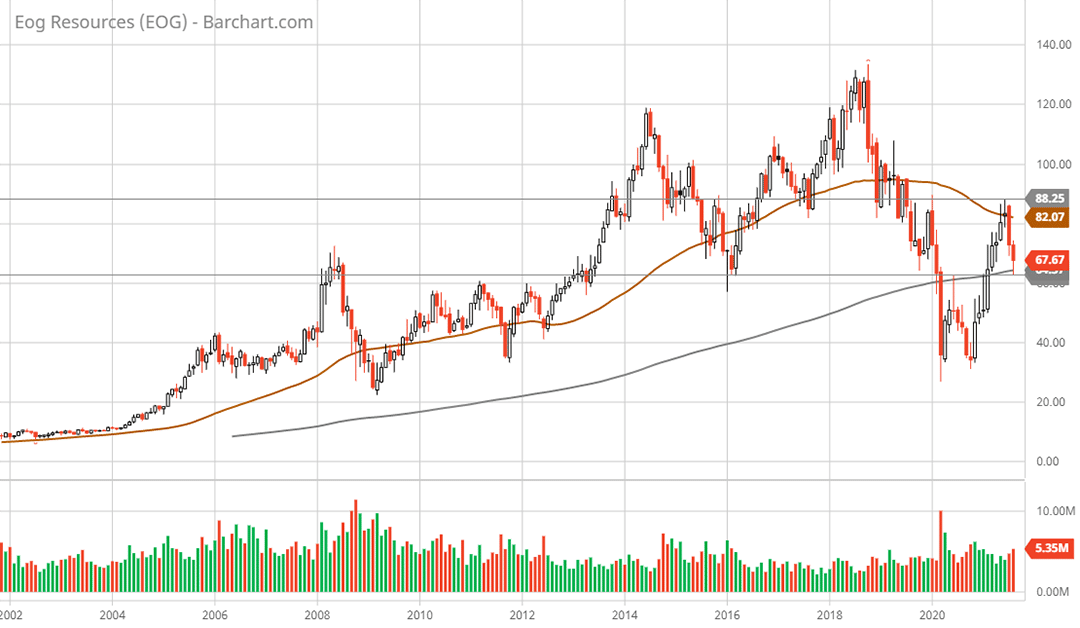
Zooming out further to the 20-year monthly chart (below), EOG’s stock has been in a corrective phase since the peak in June 2014 at $120. The stock set a nominal new high in 2018 at $133, which is best categorized as a sideways trading range that began with the peak in 2014. The stock is currently bouncing off very long-term support at the 200-month moving average (grey line on the monthly chart).
The horizontal trend lines drawn on the daily chart above are also visible on the monthly and weekly charts. On all time frames, these parallel lines define a critical trading range for EOG. The lower support level is $62.80 and the upper resistance level is $88. There is less overhead resistance on the monthly chart compared to the weekly chart suggesting a break above $100 resistance should clear the way for an attempt at all-time highs above $130, after a brief stop near $115.
All told, the technical backdrop, like the excellent fundamentals and low valuation, suggests an enticing low-risk, high-reward setup for EOG investors.
Technical resistance: The daily chart points towards $80 as the first meaningful resistance level. This is followed by heavier resistance at the $88 area which is the critical breakout zone from the W formation. Next higher resistance stands at $100 then $115, followed by all-time highs over $130.
Technical support: The stock should see strong support near its current levels at $62.80. With EOG trading above the 200-day moving average today near $67, this level is likely to firm up and offer further support.
Price as of this report 8-23-21: $67
EOG Resources Investor Relations Website: EOG Resources Investor Relations
All data in this report is compiled from the EOG Resources investor relations website and SEC filings, and where applicable, publicly available information regarding consensus earnings estimates.

