I am assigning The Walt Disney Company (NYSE:DIS) a negative risk/reward rating based on its heightened risk of persistently lower profitability, intensifying competitive pressures, a rapid slowdown in streaming subscribers, and an elevated valuation. That being said, Disney remains the content king in the entertainment industry. If the company can fend off the competition while executing a successful offensive strategy across its streaming services, the future could once again belong to the magic kingdom.
Risk/Reward Rating: Negative
Disney shares are now down over 8% since reporting Q4 2021 earnings on November 10, 2021. The company missed consensus expectations for sales and profits. Of primary concern in the investment community appears to be the large miss on Disney+ streaming subscribers and the significant reduction in operating profitability in the company’s largest segment, Media & Entertainment Distribution. Disney+ subscribers came in at 118.1 million versus the consensus expectation for 125 million. This represents a material miss and a significant underperformance versus expectations. Streaming is the core growth driver for Disney’s future, rendering this material slowdown a top concern.
Segment Results
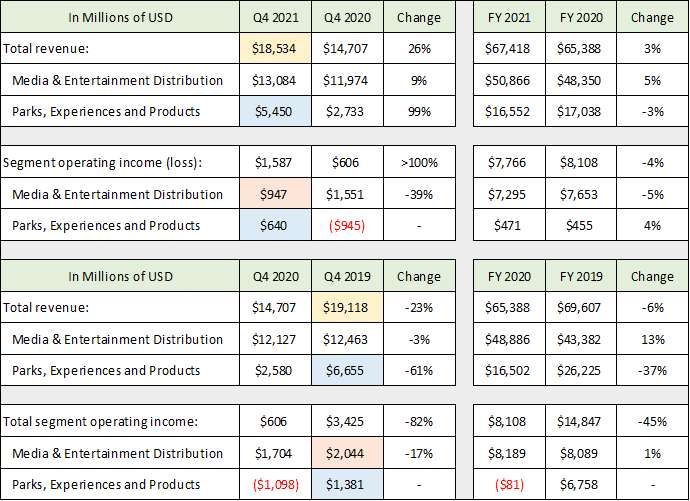
On the profitability front, Disney is experiencing margin contraction in each of its primary reporting segments compared to the pre-COVID levels of 2019. Q4 2021 which ended on October 2, 2021, was the first relatively normal operating quarter since the onset of the COVID pandemic. The following table was compiled from Disney’s Q4 2021 8-K, Q4 2020 8-K, Q4 2019 8-K, and 2020 10-K filed with the SEC. I have highlighted the key data for comparing Q4 2021 to Q4 2019 in order to illuminate the trends in Disney’s segments excluding the brunt of COVID effects.
Source: Created by Brian Kapp, stoxdox
Revenue in Q4 2021 remained below that of Q4 2019 as can be seen in the yellow highlighted cells. Parks, Experiences and Products revenue recovered to 82% of pre-COVID levels. The Media & Entertainment Distribution segment reported operating income in Q4 2021 that was 54% below the level achieved in Q4 2019 (the orange highlighted cells). Parks, Experiences, and Products operating income also came in 54% lower than in Q4 2019 (the blue highlighted cells).
It should be noted that there are no distortions caused by the $71 billion acquisition of 21st Century Fox in the Q4 numbers. As a result, Q4 2021 offers a glimpse into the organic growth rate of Disney going forward off of this larger revenue base.
Parks, Experiences and Products Segment
The Parks, Experiences and Products segment was ravaged by COVID and is likely to face a much more difficult operating environment going forward as is evidenced by the reduced operating profitability in Q4 2021 compared to Q4 2019. While revenue recovered to 82% of pre-COVID levels, operating income only recovered to 46% of the Q4 2019 figure (highlighted in blue above). Labor availability and cost as well as general cost push inflation are likely to pressure margins substantially compared to the pre-COVID period. The following table displays the pre-COVID operating profit trends for each major segment over the past twelve years and was compiled from Disney’s Q4 2021 8-K, 2020 10-K, 2017 10-K, 2014 10-K, and 2012 10-K filed with the SEC. I have highlighted the key trends.
Source: Created by Brian Kapp, stoxdox
The Q4 2021 operating margin in the Parks, Experiences and Products segment reached a new low and is well beneath the high of 26% achieved in 2019 (highlighted in blue). The upward margin trend from 2010 to 2019 looks to have reversed to a lower equilibrium state for the foreseeable future. I expect margins to resemble the 2010 to 2013 period more so than the 2014 to 2019 period in the medium term, as labor and general cost inflation are moving structurally higher. This is likely to be aggravated by continued COVID effects on capacity, operational norms, and consumer behavior.
Media & Entertainment Distribution Segment
Margin trends in the Media & Entertainment Distribution segment have been in a well-entrenched downtrend since the peak in 2015 (highlighted in yellow above). Profit margins since 2018 are extremely low compared to historical levels. Factors include the acquisition of 21st Century Fox, the expenses and operating losses associated with the new streaming services introduced in 2019, and the declining economics in the Linear Networks segment (cable and broadcasting). The following table (compiled from Disney’s Q4 2021 8-K and 2020 10-K filed with the SEC) displays the performance of this segment in greater detail.
Source: Created by Brian Kapp, stoxdox
The declining economics in the Linear Networks segment (cable and broadcasting) is highlighted in yellow. Operating income was down over $1 billion or 11% in fiscal year 2021 compared to 2020, reflecting a material margin contraction from 34% to 30%. Cable and broadcasting, Disney’s legacy cash cow businesses, are now facing stagnation and natural decay. This will be an important trend to monitor as this segment is a key funding source for the company.
There are additional cost pressures on content acquisition and content creation due to the intense and increasing competition for industry resources from the likes of Amazon (NASDAQ:AMZN) and Netflix (NASDAQ:NFLX). While the recent extremely low margins should reverse, they look likely to remain at depressed levels over the medium term relative to the past 12 years.
The Direct-to-Consumer business should continue to trend toward profitability and eventually begin to pick up the slack caused by the Linear Networks profit erosion. Unfortunately, as outlined on the Q4 conference call, the company estimates that profitability will not be achieved until 2024. The Content Sales/Licensing and Other segment will recover as content production schedules normalize post-COVID. However, margins here will likely remain depressed for some time due to the aforementioned cost pressures.
Annual Trends
Placing recent segment results in a longer-term context may shed some light on the likely persistence of the recent negative operating trends. The following table was compiled from Disney’s annual 10-K reports filed with the SEC used in the operating margin table above. There are additional segment details for the years through 2020 using the historic segment reporting categories. I have highlighted the key trends.
Source: Created by Brian Kapp, stoxdox
Media Networks (Linear Networks) revenue and operating income have stagnated since 2014, excluding the 21st Century Fox acquisition in 2019. The $71 billion acquisition of 21st Century Fox is responsible for the revenue growth reported in 2019 and 2020 which distorts the underlying trend. The organic trend is highlighted in yellow, from 2014 to 2018 for revenue and 2014 to 2019 for operating income. Overall operating profit for the Media & Entertainment Distribution segment has stagnated and declined since 2014 (highlighted in blue).
Operating income for the entire company is also stagnant since 2014, excluding the COVID collapse of 2020 (highlighted in orange). The COVID collapse hit Disney’s top performing segment from an operating income growth perspective. The Parks, Experiences and Products segment achieved 16% annualized operating income growth from 2010 through 2019. This segment came to represent 45% of total operating income in 2019, buttressing the declining operating income in the Media & Entertainment Distribution segment. The profitability of this segment looks to have reset lower for the medium term. Disney’s profitability turnaround compared to its prior profitability peak in 2018 is likely to take several years.
Annual Performance
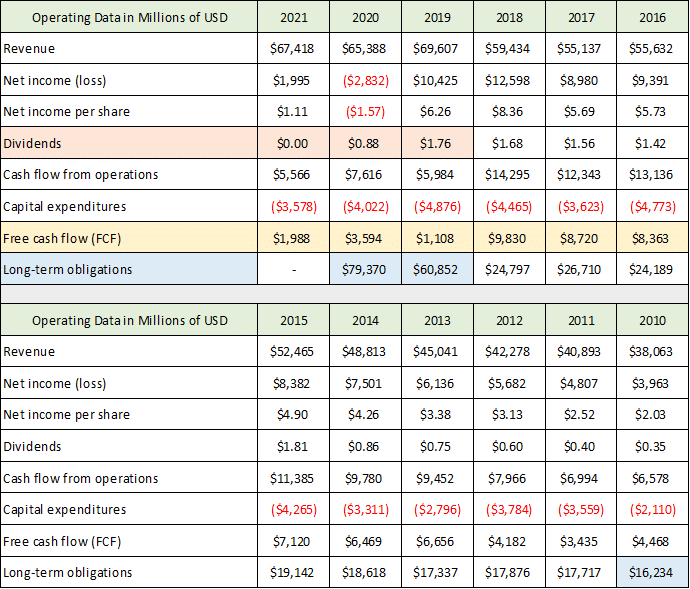
The profitability peak in 2018 receives strong confirmation from Disney’s annual free cash flow. In the following table compiled from the same annual reports as above, I take a step back from segment reporting to view the company’s broad performance. I have highlighted the most important data points. Please note that the 21st Century Fox acquisition and Hulu were consolidated in Disney’s financial reporting beginning on March 30, 2019 (midway through the 2019 fiscal year).
Source: Created by Brian Kapp, stoxdox
The most important trend is the dramatic reduction in free cash flow after 2019 (highlighted in yellow). COVID was a large contributor to the declines in 2020 and 2021, while large tax payments contributed to the 2019 free cash flow reduction. Nonetheless, as outlined in the operating margin discussion, the declines are also being driven by a material reduction in operating profitability excluding one-off events.
The company’s decision to not reinstate the dividend payment in 2021 and into 2022 (the dividend row highlighted in orange) is a signal that the profitability and free cash flow reduction contains a substantial structural element. If this were not the case, given that business is largely normalized going into Q1 2022, one would expect a resumption of the normal dividend payment. While Disney was never a large dividend payer, the payment was material and added to the total return available to investors. The company’s decision on the dividend going forward will likely serve as an excellent signal regarding management’s confidence in the underlying profitability and free cash flow of the business.
Adding to the free cash flow and dividend concerns is the company’s massive increase in debt since 2018 of $55 billion (highlighted in blue). This is largely a result of the 21st Century Fox acquisition. The long-term liability increase since 2010 stands at a whopping $63 billion. The possibility of structurally-reduced medium-term profitability creates a heightened level of execution risk for Disney through 2024. Disney expects to achieve profitability in its streaming business by this time.
Balance Sheet
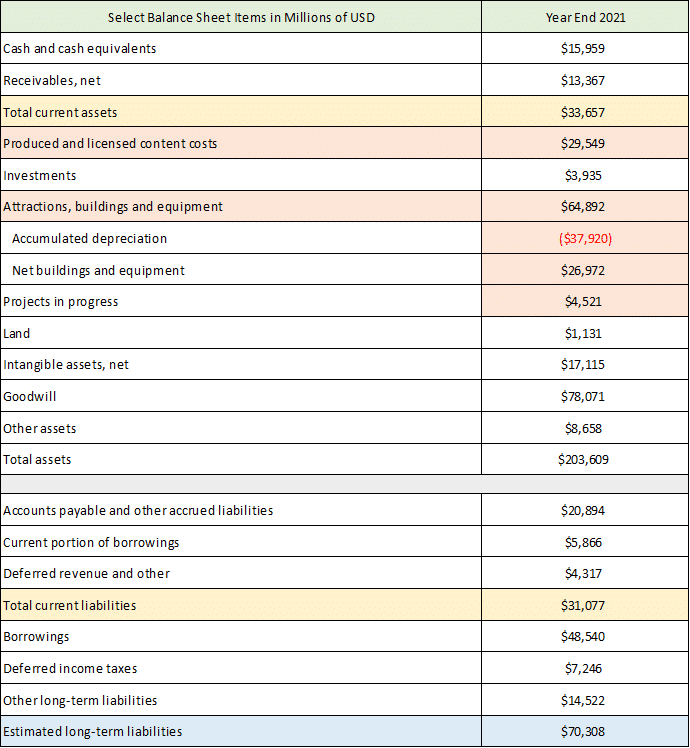
Given the potential for financial stress that Disney has not experienced for some time, a summary view of the balance sheet is in order. The following select balance sheet items were compiled from Disney’s Q4 2021 8-K filed with the SEC. I have highlighted the key data.
Source: Created by Brian Kapp, stoxdox
The yellow highlighted cells show that Disney has a net current asset position of $2.6 billion (current assets minus current liabilities). This is normal for large media companies. The estimated long-term liabilities (highlighted in blue) are the concern. The $79 billion of long-term liabilities discussed previously are reported by Disney as of 2020-year end in its 10-K. The company has not yet filed its 10-K for 2021 so I have estimated the number at $70 billion based on its earnings release.
The remaining data is provided for reference to give a flavor for the company’s various assets and liabilities. Disney’s primary assets are its content (the Media & Entertainment Distribution segment) and its physical property (the Parks, Experiences and Products segment). I have highlighted these important asset categories in orange. The key takeaway on the asset side is that Disney operates in a capital-intensive industry which requires consistent reinvestment in physical structures and content creation and acquisition. Additionally, many of the physical assets are specific to Disney’s use cases which renders them less marketable from a balance sheet management standpoint. This is important because it means that Disney benefits less than other physical asset owners from generalized inflation and is relatively harmed by the increased cost associated with maintaining the assets.
Future Growth
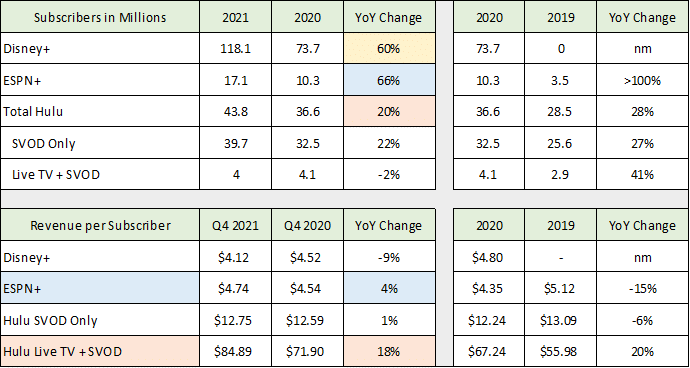
Disney’s future growth prospects are likely to be more dependent on content and distribution as opposed to physical structures, which should lessen balance sheet pressure over time. In this regard, Disney’s streaming services are the most likely engine of growth. The importance of streaming growth is evidenced by the large selloff following the Q4 Disney+ subscriber growth disappointment. The trends in this segment will be a key performance indicator going forward. The following table displays the trends in the Direct-to-Consumer segment since the broad introduction of the services in 2019. The data was compiled from Disney’s Q4 2021 8-K and Q4 2020 8-K filed with the SEC.
Source: Created by Brian Kapp, stoxdox
Disney has been remarkably successful at growing its subscriber base in both number and speed. The highlighted cells in the upper portion of the table display the YoY (year-over-year) growth rates. ESPN+ is the standout performer up 66% YoY, followed by Disney+ at 60% and Hulu at 20%. In the lower section of the table, I have highlighted the segments demonstrating pricing power as this will be crucial in a more inflationary environment.
The trends in pricing for each category will be important to monitor as pricing power materially increases the economics of the streaming business model. For the moment, pricing power overall looks to be minimal as the two largest categories, Disney+ and Hulu SVOD Only, show flat to declining pricing trends.
Recent Growth
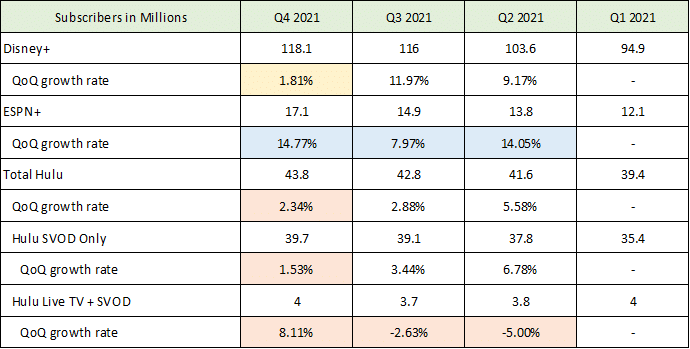
The lack of current pricing power in the Disney+ and Hulu businesses likely contributed to the adverse reaction of the stock price when Disney released disappointing subscriber growth numbers in Q4 2021. Facing materially reduced profitability levels across all of its segments, Disney’s future growth engines take on heightened importance. The following table displays the latest trends across each streaming category and was compiled from Disney’s Q4 2021 8-K, Q3 2021 10-Q, Q2 2021 10-Q, and Q1 2021 10-Q filed with the SEC.
Source: Created by Brian Kapp, stoxdox
The QoQ (quarter-over-quarter) growth of ESPN+ is superb and points toward limited penetration and a substantial growth opportunity (the blue highlighted cells). ESPN+ offers many sizeable growth vectors such as gambling, fantasy sports, and augmented reality which further enhances the growth opportunity. The potential pricing power discussed above would add pure operating leverage. It should be noted that Disney owns a portion of DraftKings (NASDAQ:DKNG) and is presently focused on this particular opportunity.
The growth scare is emanating from the remaining categories which all received material boosts from the COVID lockdowns (highlighted in yellow and orange). A substantial slowdown occurred in the two largest streaming categories, Disney+ and Hulu SVOD Only. Each category grew at only 1.81% and 1.53% respectively in Q4 2021 compared to Q3 2021, which translates into roughly 10% annualized growth rates. This is not what the marketplace is expecting of Disney’s core growth engines.
On the Q4 conference call management stated that new content is critical for signing up new subscribers given the initial market penetration of the streaming services. The company expects new content to begin to drive subscriber growth again in the latter half of 2022. With COVID receding and the pull forward of streaming customers due to COVID complete (outside of ESPN+), Disney is likely facing challenging quarters ahead from a streaming growth perspective. This dynamic could weigh on growth investor sentiment toward Disney’s stock, opening the door for value investors for whom the valuation of Disney will take center stage.
Earnings and Valuation
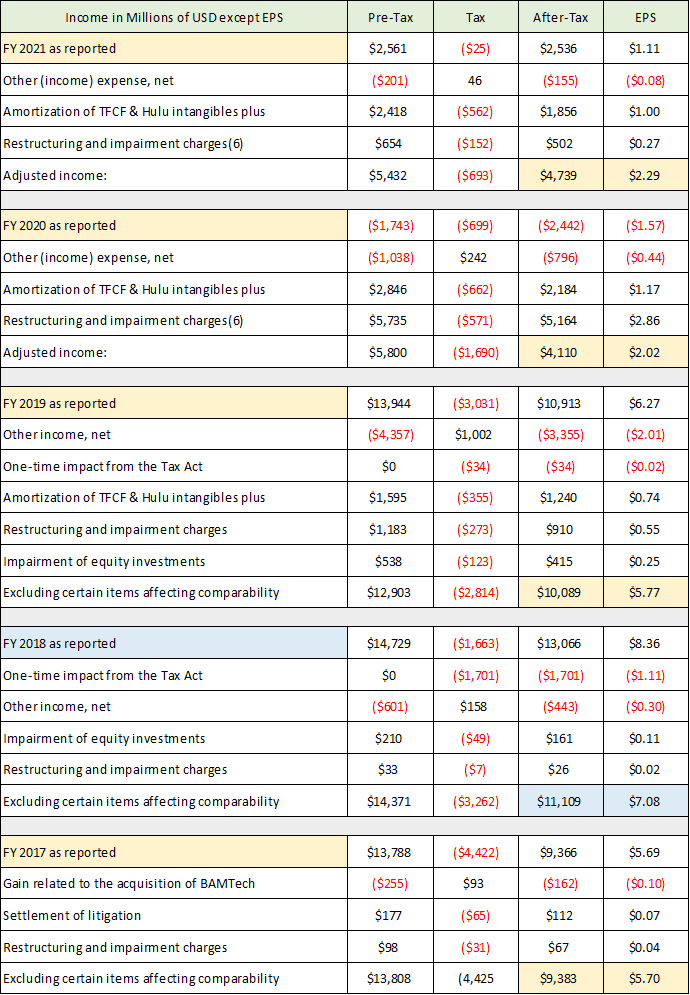
Disney’s reported earnings have been heavily distorted by the 21st Century Fox acquisition in 2019. As a result, I believe the company’s adjustments to reported earnings are appropriate and present a clear picture of Disney’s earnings power. The following table presents Disney’s adjusted earnings for the past five years and was compiled from the SEC filings used thus far. I have provided the full adjustment details for reference and have highlighted the bottom line for each year.
Source: Created by Brian Kapp, stoxdox
Adjusted earnings peaked in 2018 at $7.08 per share. The central earnings tendency around this peak was in the $5.70 range in 2017 and 2019. The 2021 adjusted earnings figure of $2.29 per share probably offers a clear view into the current earnings potential of the Media & Entertainment Distribution segment. The Parks, Experiences and Products segment produced only 6% of total operating income in 2021.
The Parks, Experiences and Products segment produced 45% of total operating income in 2019. With an adjusted EPS of $5.77 in 2019, roughly $2.60 was provided by this segment at its peak operating profit margin of 26%. Adding this peak earnings estimate to the $2.29 per share reported in 2021 produces a potential earnings estimate for Disney of $4.89 per share. However, the 26% operating margin is unlikely to be achieved due to the profitability stress discussed above. On the other hand, profit improvement from recently depressed levels in the Media & Entertainment Distribution segment is likely but should be a more gradual multiyear process. As a result, Disney appears likely to report earnings materially less than $4.89 in the coming year.
Consensus Estimates
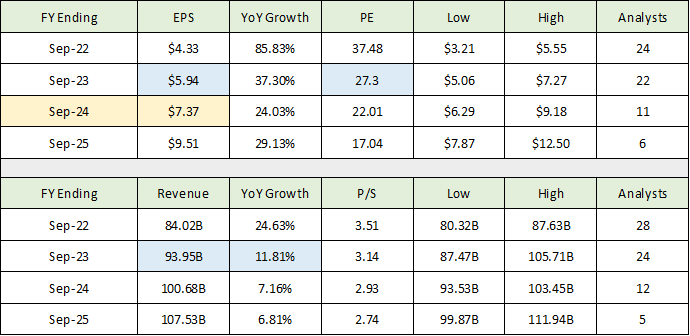
With the peak central tendency of earnings from 2017 and 2019 in the $5.70 per share range and the maximum estimate of $4.89 per share in the coming year, we can begin to place consensus earnings estimates into context. The following table was compiled from Seeking Alpha and displays the consensus earnings and revenue estimates for Disney through fiscal 2025 (this data is updated frequently).
Source: Created by Brian Kapp, stoxdox
The estimate for fiscal 2022 appears to be realistic. The 37x forward PE (price-to-earnings ratio) is materially elevated compared to current large company market averages which trade between 22x and 30x forward earnings estimates (S&P 500: 22x and Nasdaq 100: 30x). The sales estimate for 2022 likely requires a 14% growth rate from the Media & Entertainment Distribution segment, assuming a full recovery to 2019 levels in the Parks, Experiences and Products segment. This could prove challenging, but attainable.
I have highlighted in blue what I believe could be challenging targets for Disney. On the revenue front, 12% growth in 2023 appears to be aggressive. The company grew sales at 5.7% per year from 2010 through 2018. This time period removes the effects of the large 21st Century Fox acquisition and COVID. Coming off a fully recovered 2022, there is a heightened risk of disappointment here. The consensus estimate of $5.94 for 2023 may also be at risk as a result, although it is in the ballpark of the $5.70 central tendency around the prior peak in 2018. At 27x the 2023 earnings estimate, Disney is valued well above the current blue-chip average of 22x the 2022 consensus earnings estimate (S&P 500).
The current consensus earnings estimate of $7.37 for 2024 (highlighted in yellow) would mark a return to the 2018 peak adjusted earnings of $7.02 per share. If this were to be achieved, it would mark six years of stagnating earnings for Disney. Given that this performance is relatively poor, it does call into question the premium valuation assigned to Disney by the market.
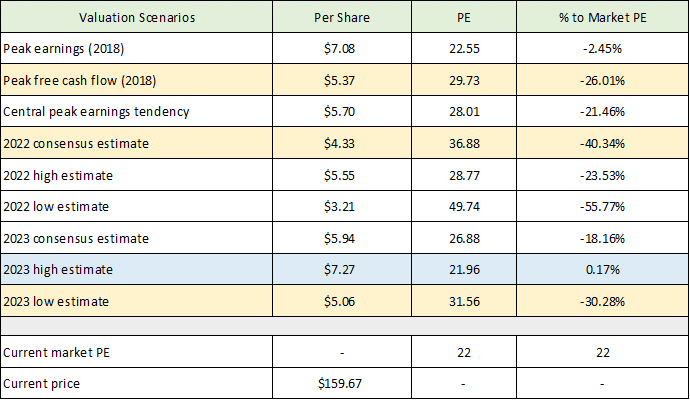
Recall from above that peak free cash flow for Disney occurred in 2018 at $9.8 billion. This equates to $5.37 per share and is an excellent earnings proxy. The peak free cash flow figure also coincides with the central tendency for adjusted earnings of $5.70 per share in 2017 and 2019. The following table summarizes Disney’s valuation based on several of the earnings estimates discussed here. In the final column I estimate the return potential if Disney’s valuation reverts to the current market average.
Source: Created by Brian Kapp, stoxdox
I have highlighted in yellow what I believe to be the most probable downside return risk potential which ranges from -26% to -40%. The highest return estimate in the above table is highlighted in blue and suggests little upside potential in the near term.
Technicals
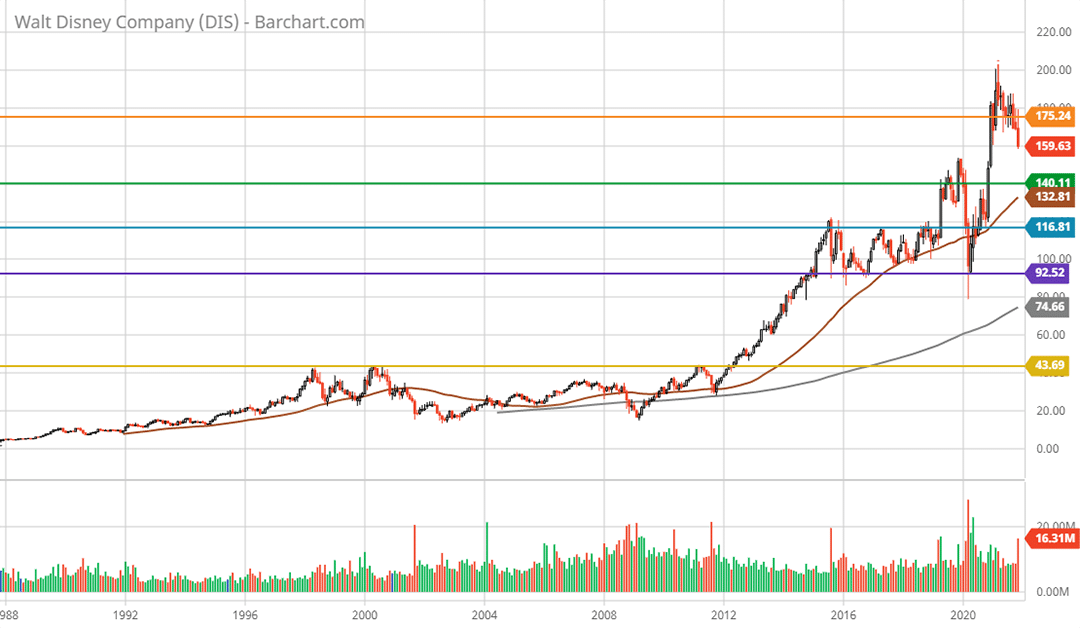
The downside asymmetry in the potential return estimates above is well supported by the technical backdrop of Disney shares. I have marked key long-term support and resistance levels on the following monthly chart for a bird’s eye view of Disney’s technical setup.
Disney maximum monthly chart. Created by Brian Kapp using a chart from Barchart.com
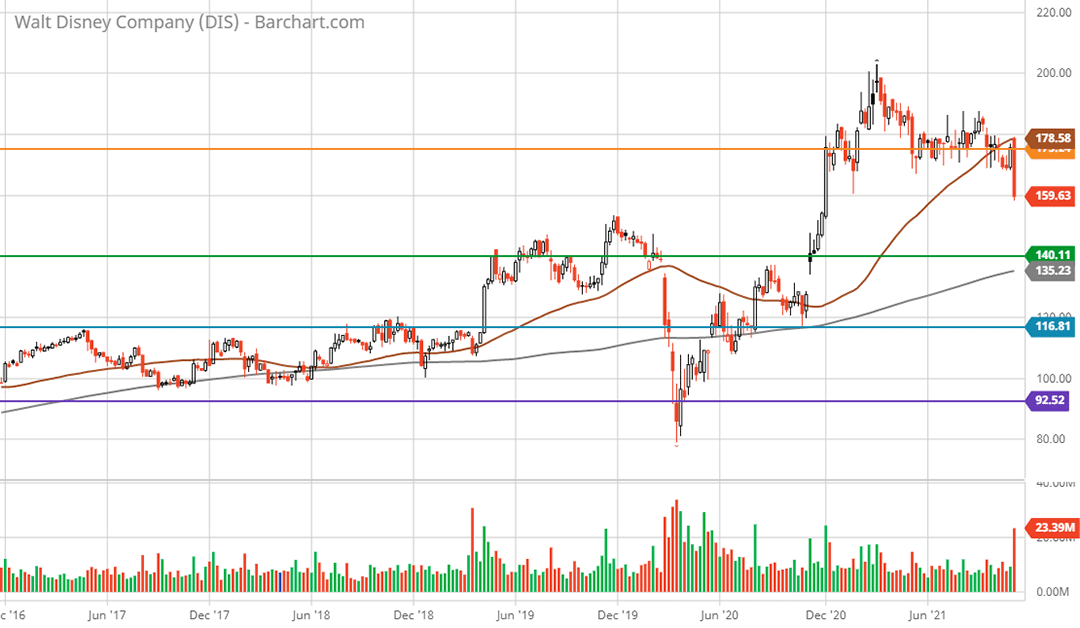
The orange line represents all-time high resistance near $175. This is likely to provide stiff resistance given the reduced operating trends and represents minimal upside potential of 10%. Nearest support is at the green line near $140 which was all-time high resistance in 2019 and 2020. This represents downside risk of 12%. Given the elevated valuation at $140 and the limited trading history above it, this level is likely to offer tenuous support. The limited trading history above $140 can be seen more clearly on the following 5-year weekly chart.
Disney 5-year weekly chart. Created by Brian Kapp using a chart from Barchart.com
I have carried the support and resistance lines over from the monthly chart. What is notable is the surge from $140 to $180 in the final weeks of 2020. This was an unstable upward move in that there was little trading between $140 and $180. The explosion higher was likely due to excitement around Disney+ subscriber growth. Ever since, the shares have been in a distribution phase which was confirmed by the break beneath the orange support line in response to the Q4 2021 earnings report.
The first major support zone looks to be near $117 at the blue line. This level was strong resistance from 2016 to 2018 as Disney achieved peak earnings. Additionally, this level served as support during the rebound from the COVID crash in 2020. The downside risk to this support level is -27%. This aligns well with the -26% estimate arrived at above by applying the current forward market PE to Disney’s peak free cash flow per share. It appears that this level has a high probability of being tested and should offer strong technical support.
The purple line near $93 represents the next lower support level which was near the COVID crash lows. This appears to be a worst-case scenario as things stand and represents downside risk of -42%. This happens to align very well with the downside risk estimate arrived at by applying the current forward market PE to Disney’s forward earnings estimate. As a result, a lower test of this zone cannot be ruled out.
Summary
On a cautionary note, please refer back to the monthly chart above and view the yellow support line. While this is highly unlikely to be tested, it was resistance and served as a ceiling for Disney shares for 14 years, from 1998 to 2012. I point this out because sentiment toward Disney’s prospects was extraordinarily bullish in the late 1990s which led to an elevated valuation. The subsequent valuation reversion period of 14 years required more patience than most investors were willing or able to endure. This history of a prolonged sideways move serves as a reminder of the importance of valuation for future returns.
Disney is a great company and could become a great stock if it can execute on the exceptional growth opportunities over the coming decade. This alone should place Disney on most investors watchlist. However, the future is not guaranteed. The same growth opportunities are being pursued by every major media and consumer technology company in the world today.
Disney’s continued suspension of its dividend signals the likely persistence of a reduced operating income environment facing the company through 2024, compared to the peak years of 2017 to 2019. The decision to reinvest for growth at this moment should prove to be a wise choice looking through the end of the decade. That being said, the elevated relative valuation manifests as a heightened risk of multiple compression thus creating a negatively skewed risk/reward asymmetry. For investors looking to accumulate the shares, the $117 area may offer the first attractive risk/reward opportunity.
Price as of report date 11-15-21: $159.67
Disney Investor Relations Website: Disney Investor Relations Website


