Risk/Reward Rating: Negative
Salesforce reported Q2 fiscal 2022 earnings the evening of August 25, 2021. The results were greeted with a 5.4% stock rally the following morning. The intraday share price gain was reversed, and the stock finished up just 2.6% which is where it opened for trading on the day. All in all, the revenue results continue to be strong coming in at 23% growth compared to last year (21% excluding currency effects).
Growth Drivers
The growth was driven by the recent acquisitions of Tableau and MuleSoft which dominated the top ten largest customer wins in the quarter. Tableau was involved in nine of the top ten deal wins while MuleSoft was involved in eight of the top ten deals. Saleforce’s core Sales Cloud revenue grew 15% in the quarter which, while still respectable, is decelerating as hypergrowth is in the rearview mirror.
Growth Strategy Risks
Stepping back for a moment, Salesforce has created a mature and dominant position as the world’s #1 customer relationship management (CRM) platform evidenced by its use in over 150,000 companies. As CRM growth matures and slows, in recent years Salesforce has increasingly turned to acquisitions to maintain revenue growth. This is evidenced by Tableau and MuleSoft driving sales growth in the biggest customer deals during Q2.
To quote the CEO, Marc Benioff, from the Q2 earnings conference call: “Our Customer 360 platform is now fueled by a herd of unicorns perfectly designed for this all-digital world.”
The risk for Salesforce’s stock resides in replacing organic revenue growth with acquired revenue growth. Generally speaking, growth through acquisitions usually leads to a lower valuation multiple for the acquiring company as the growth becomes lower quality compared to organic revenue growth. The lower valuation multiple risk is amplified when the acquisitions are made at extraordinary valuations (unicorns).
This is evidenced by the most recent acquisition of Slack, which closed at the end of Q2 2022. Slack will start contributing to Salesforce’s financial results going forward and is expected to generate $530 million of revenue for Salesforce in the second half of the year. Salesforce purchased Slack for $27.7 billion which equates to an incredible 26x the expected second half revenue run rate annualized. Slack revenue growth has slowed to 39% in Q2 2022 after a period of hypergrowth fueled by the COVID lockdowns and scramble for virtual collaboration tools by businesses.
Historically speaking, it is exceedingly difficult to generate attractive long-term returns on an investment when one pays 26x sales. It is difficult to achieve a high return on capital on such a high-priced asset as it begins to drag down the return on total capital for the company overall. As a result, the lower returns often translate into a lower valuation multiple for the acquiring company’s stock price.
Financial Results and Valuation
As mentioned in the opening paragraph, sales growth (driven by acquisitions) was a healthy 23%. Turning to the bottom line for Salesforce becomes tricky due to the company’s heavy use of adjustments to GAAP (generally accepted accounting principles) financial results. The cash flow from operations is unadjusted and a good place to start. The table below summarizes the operating cash flow per year for the last four fiscal years and breaks them out by first half (1H) and second half (2H) of each year. *Note that for 2022, the first half is actual results, and the second half and full year are estimates based on company guidance.
The first thing that jumps out is that the growth rate of cash flow from operations is on pace to average 13% for fiscal years 2022 and 2021 compared with growth of 27.46% in fiscal 2020. 13% growth is a material deceleration and on an absolute basis is not indicative of a hypergrowth company.
It should be noted that cash flow through the first half of 2022 is elevated as Salesforce collected on receivables from companies that had been granted extended payment terms during COVID. Many of Salesforce’s customers lost much of their sales due to the economic shutdowns and Salesforce extended payment terms to maintain the relationships. As a result, averaging 2022 and 2021 provides a more accurate measure of the underlying trend.
Salesforce expects to spend 3% of revenue, $789 million, on capital expenditures this year. Subtracting this from cash flow brings the free cash flow estimate for 2022 to $4.7 billion. In summary, Salesforce is valued at 58x expected 2022 free cash flow and 50x expected 2022 cash flow from operations which is growing at 13% on average in recent years (using the fully diluted share count).
The Income Statement
Salesforce heavily adjusts the presentation of its income statement which requires a nuanced approach. The largest adjustment comes from the removal of stock-based compensation expense followed by the removal of goodwill amortization expense resulting from past acquisitions. Goodwill is the price paid for a company minus the identifiable assets received in the acquisition. It must be expensed over time. Each of these are non-cash expenses. The following table summarizes Salesforce’s income (*2022 is estimated based on company guidance).
The first thing to jump out is the incredible valuation based on operating income at 580x. This is GAAP operating income and includes stock-based compensation expense and amortization of intangibles from acquisitions (goodwill). If it is a realistic estimation of Salesforce’s earnings power, it is an extraordinary valuation
Income Adjustments
Turning to the adjustments, GAAP operating income is 1.8% of sales, stock-based compensation expense is 10.6% of sales, and amortization of intangibles is 6.1% of sales. This brings the non-GAAP operating margin to 18.5%. Using the non-GAAP numbers, the valuation is 62x earnings which is high by historical standards, however, much improved compared to 580x GAAP operating income.
The amortization of intangibles is tricky. While a case can be made to expense some of it, the reality is that it is subjective and requires a case-by-case treatment. In the Slack acquisition for example, expensing is likely justified as the acquisition value was extraordinary. The Slack brand equity (goodwill) is likely to depreciate from the purchase price and give way to the Salesforce brand in the end.
In fact, on the Q2 earnings conference call the company referred to Slack as an extension of the CRM platform. The company believes Slack will be a key feature for their Customer 360 offering. The acquisition appears to be more of a defensive move by Salesforce so that it can acquire functionality for its suite of offerings while at the same time offer avenues for sales growth. Essentially, Salesforce bought the functionality for its platform rather than build it in-house (which would have cost a fraction of the $27.7 billion paid for Slack).
Stock-based compensation expense is a real economic expense that can be quantified. The company is transferring shares or ownership in the company (rather than cash) as compensation. Salesforce could sell the shares in the market for cash rather than transferring them to employees as compensation. Thus, in terms of the real economics of the situation, share-based compensation is an actual economic expense. To exclude this expense in its entirety is to ignore the economic reality of the situation.
If we exclude intangible amortization (giving Salesforce the benefit of the doubt on its acquisition prowess) but keep stock-based compensation expense (as it is a real expense), Salesforce’s operating income margin is estimated to be 7.9% of revenue. On this basis, Salesforce is currently valued at 151x operating income. This is an extreme valuation.
It is reasonable to argue that stock-based compensation provides an employee performance incentive that cash compensation does not. In fact, many people weigh stock-based compensation differently. Somewhat arbitrarily as an example, if we exclude one-third of the stock-based compensation expense, assuming it provides an employee incentive value that cash compensation would not, the valuation comes in at 91x this ‘doubly adjusted’ operating income, which again is historically an extreme valuation.
Summary
On the bright side, Salesforce reaffirmed in its Q2 earnings conference call that it expects to achieve $50 billion of revenue by fiscal year 2026. This is almost double the fiscal 2022 sales projection. However, to achieve this goal Salesforce will likely require several large acquisitions which exposes the company to the valuation risk discussed above. As an example, this sales goal would place Salesforce in the same size category as Oracle who also turned to acquisitions to reach this type of scale. Oracle today is valued at 19x earnings and 6x sales. If one were to apply Oracle’s 6x sales valuation to the $50 billion Salesforce target, it would place the market capitalization of Salesforce at the end of fiscal year 2026 roughly where it is today.
All told, Salesforce is a great company with a stock price that is fully valued. The various valuation multiples on profitability metrics run the full spectrum. From 50x cash flow on the low end to 580x operating income on the high end, with 62x non-GAAP eps, 91x ‘doubly adjusted’ operating income and 151x adjusted operating income in the middle. It should be noted that in past economic cycles in technology, with the value of hindsight, a valuation of 10.45x sales was looked at as extreme. The risks outweigh the rewards at the current price as there is little excess return potential left on the table.
Technicals
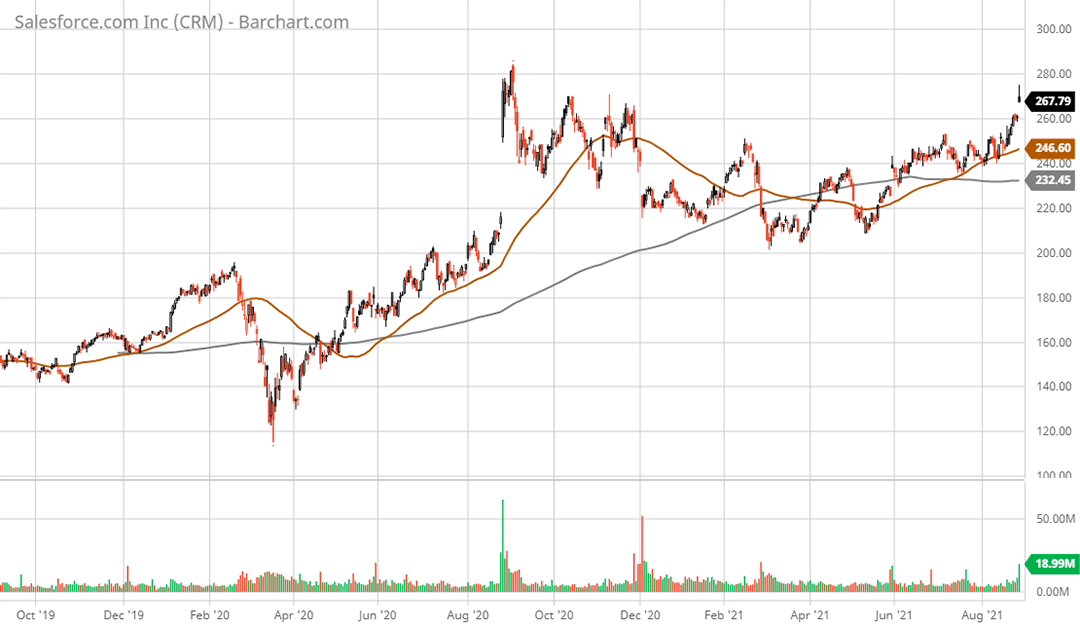
Technical backdrop: Salesforce stock peaked one year ago at $285 per share after gapping up by 36% on better-than-expected results and future guidance. Ever since this incredible move, the stock has been correcting and trying to establish a sustainable base from which to grow again. The stock reversed the entirety of this upward gap and bottomed in May 2021 at $208, exactly where it was prior to the gap up one year ago.
Since this bottom, Salesforce is attempting to reestablish upward momentum. The 50-day moving average (brown line on the 2-year daily chart below) crossed back above the 200-day moving average (grey line on the daily chart) on July 15, 2021. This suggests a tenuous technical uptrend as the opposite had occurred on March 18, 2021, suggesting a downtrend had begun. Given the valuation, this seesaw action is likely to persist. The 200-day moving average stands at $232 while the 50-day moving average stands at $246.
Salesforce 2-year daily chart
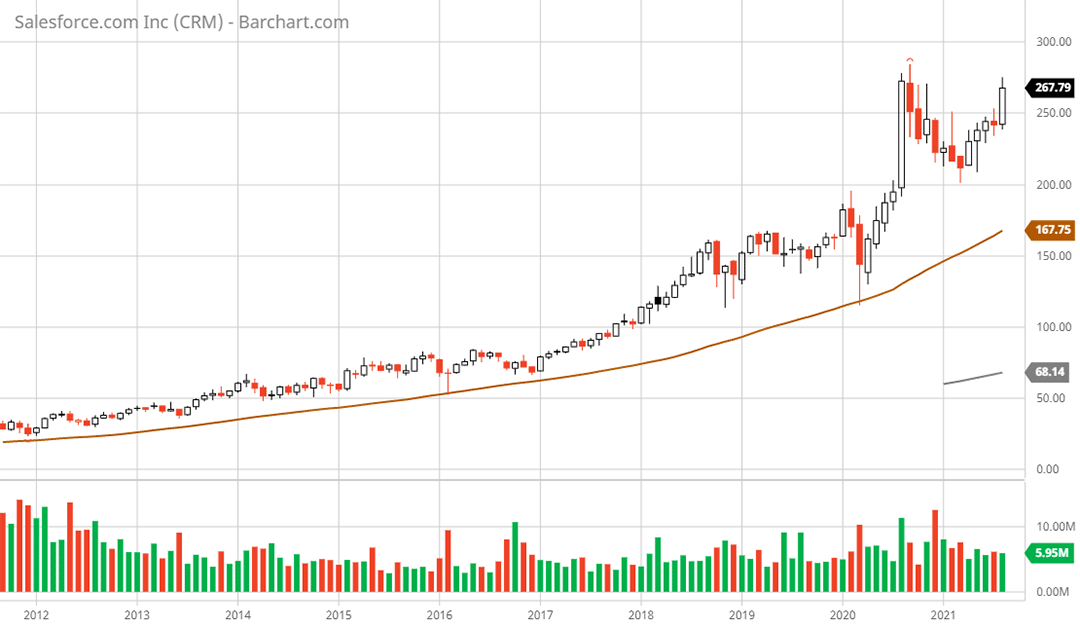
Zooming out to the 10-year monthly chart, Salesforce has repeatedly touched the 50-month moving average (brown line on the 10-year monthly chart) which now stands at $168. The current share price is 37% above this long-term moving average. Against the valuation backdrop and growth strategy discussed above, a reconnection with this long-term moving average is likely at some point.
Salesforce 10-year monthly chart
Technical support: The nearest support is in the area of the 50-day moving average at $246 and the 200-day moving average at $232. The next lower support is just above the $200 area. This was lower support throughout 2021 and the gap up area from 2020.
Technical resistance: The current level to the all-time high at $285 should offer stiff resistance.
Price as of this report 8-27-21: $273.14
Salesforce Investor Relations Website: Salesforce Investor Relations
All data in this report is compiled from the Salesforce investor relations website and SEC filings, and where applicable publicly available information regarding consensus earnings estimates.


