I am assigning Corning Incorporated (NYSE:GLW) a positive risk/reward rating based on its above-average growth prospects, its sizable margin expansion opportunity, its industry leadership position, and its deeply discounted valuation.
Risk/Reward Rating: Positive
Corning is an industry leader in display technologies, optical communications, pollution control, and materials science. The company’s materials science expertise has created a competitive advantage in the form of patented technology, manufacturing processes, and products. Corning’s technology leadership and investment discipline have enabled it to continually innovate and apply its technology platform to an expanding number of use cases.
Technology Platform
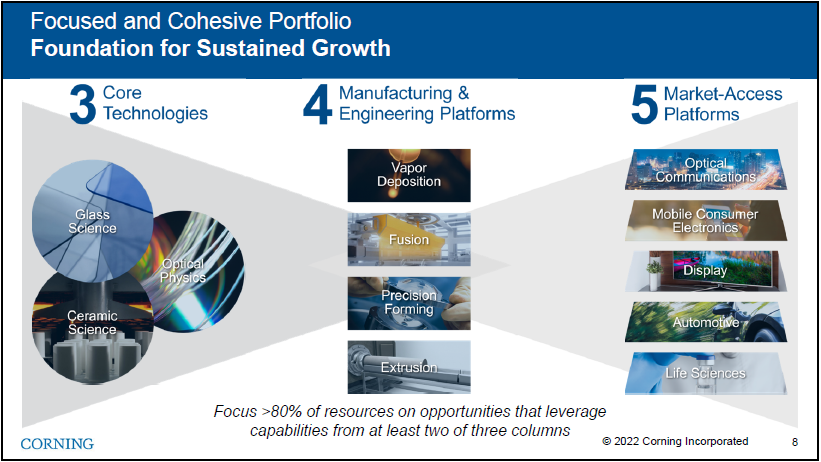
Corning defines its technology platform across three vectors: Core Technologies, Manufacturing & Engineering Platforms, and Market-Access Platforms. This platform framework forms the foundation for understanding Corning’s business model. The following image from Corning’s Q4 2021 earnings presentation provides an overview of this framework.
Source: Corning Incorporated’s Q4 2021 earnings presentation
Please note that Corning has structured its reportable business segments in line with the five Market-Access Platforms. Each of the five business segments leverages the three Core Technologies and four Manufacturing & Engineering Platforms to develop and deliver solutions to the marketplace. Importantly, each of the five Market-Access Platforms serve industries and use cases that are on the cutting edge of innovation in today’s economy.
Segment Performance
The Display Technologies segment is Corning’s largest income-producing segment and is the business unit that most investors associate with the company. This segment manufactures glass substrates for flat panel displays that are used primarily in televisions, notebook computers, desktop monitors, tablets, and handheld devices. When asked about investors’ view of Corning as being primarily a display company, Dr. Jeffrey Evenson (Corning’s Chief Strategy Officer) had this to say at the Morgan Stanley 2022 Technology, Media, and Telecom Conference (emphasis added):
internally, we have a display business, but we really think of it as being long our fusion assets, which is the proprietary manufacturing technique that we use for flat glass.
Further detail in regard to the Display Technologies segment and the underlying technology is provided in Corning’s 2021 10-K filed with the SEC:
This segment develops, manufactures, and supplies high quality glass substrates using technology expertise and a proprietary fusion manufacturing process, which Corning invented and is the cornerstone of the Company’s technology leadership… we believe it is the most cost-effective process in producing large size substrates.
A key theme for the Corning investment case is the application of common, core technologies to each of the company’s primary business segments. Essentially, the underlying strategy is the expansion of use cases for which Corning’s technology leadership can be applied. This strategy enables Corning to leverage its substantial investment in intellectual property, which is summarized in the following table compiled from the 2021 10-K.
Source: Created by Brian Kapp, stoxdox
The following passage from the discussion with Dr. Jeffrey Evenson at the Morgan Stanley conference further highlights Corning’s technological capabilities:
We’re making pieces of glass more than twice as big as a king-sized bed, thinner than your business card and locally flat to less than 200 atoms… It has many applications outside of the display industry. The Gorilla Glass is the biggest one we use today. We have a growing business in automotive glass. We’re looking at various architectural applications…
Display Technologies
As discussed above, in reviewing Corning’s business segment performance it is important to keep in mind that there is a common technology platform underlying each segment. This creates the opportunity for substantial operational leverage as growth unfolds across each of its business segments. The following table summarizes the performance of the Display Technologies segment and was compiled from Corning’s 2021 10-K, 2018 10-K, and 2015 10-K filed with the SEC. I have highlighted the key data points.
Source: Created by Brian Kapp, stoxdox
At 42% of total income, the Display Technologies segment is by far the largest contributor to Corning’s profitability, while generating 26% of total sales (highlighted in blue). Importantly, this segment has been under considerable margin pressure since 2013. In fact, net income has been contracting in this key segment over the past eight years. This reality is a primary reason for Corning’s subdued share price performance since the market peak between 2006 and 2008 (+33% versus +175% for the S&P 500).
I have highlighted the margin compression trend in yellow. The bottom occurred in 2020 at 22.6% and is now rebounding strongly coming in at 26% in 2021. Corning operates under long-term contracts with its customers and is in the process of securing price increases in response to the heightened inflation of recent years. This bodes well for the sustainability of the increasing profit margin trend and opens the door to revisiting the higher levels achieved historically.
Importantly, Corning has been able to grow its revenue in this segment in recent years even as the unit sales backdrop for consumer electronics has been relatively flat. For example, in the smartphone market Corning has grown its revenue every year since 2016 against flat industrywide unit volumes. In essence, Corning is taking a larger share of the display market during a period of exceedingly difficult end market demand growth.
The well-established trend of increasing screen sizes each year alone should continue to support revenue growth in line with the past eight years in the 5% range. Any acceleration in end-unit consumer electronics demand would then create an opportunity for much higher cyclical growth rates against this stable growth backdrop.
Optical Communications
The Optical Communications segment has experienced its own difficulties in the past. For those familiar with the late 1990s technology bubble, the Optical Communications segment drove Corning’s share price up an incredible 1300% in just two years as the fiber optic backbone of the internet buildout was in full bloom. The fallout from the prior bubble period impaired this segment for some time afterwards.
Today, Optical Communications is Corning’s largest business segment by revenue at 31% of the total, while producing 24% of net income (highlighted in blue below). The following table was compiled from Corning’s three annual reports used above and displays the key operating results for the segment.
Source: Created by Brian Kapp, stoxdox
Optical Communications is the fastest growing net income segment over the past eight years. I have highlighted the margin and profitability trends in yellow. Income growth of 14% over this period far outstrips the segment’s sales growth of 8%. All indications point toward stable margins with material upside potential going forward.
The upside potential over the coming years is well supported. Public and private global infrastructure plans are targeting full global penetration of broadband communications generally and 5G capabilities more specifically. With the recent US infrastructure bill alone, Corning believes it will win a material share of a $4 to $5 billion opportunity over the coming years. This in itself is a sizeable growth opportunity coming off a revenue base of $4.3 billion in 2021. Dr. Jeffrey Evenson discussed the Optical Communications growth opportunity at the Morgan Stanley conference:
we have a significant backlog coming into 2022… It will be a pretty significant driver of our ’22 growth… Secondly… there’s a lot of infrastructure money out there… maybe $4 billion or $5 billion or so… we will take a significant portion… So I think there’s… a nice long period of time in the future for us to be able to grow…
In fact, other countries are implementing similar broadband infrastructure plans, such as in the UK, Germany, and Canada. This is a global trend for government stimulus alongside the much larger secular growth plans of the private sector. Private sector growth looks particularly robust and is increasingly data-intensive. Trends in place fully support well-above average growth in the 5G, cloud, and data center markets in addition to Corning’s core telecommunications carrier market. Against such a robust spending backdrop, the opportunity to expand profit margins should be material.
In addition to the robust spending backdrop, in recent years Corning has been positioning itself as a solutions provider rather than simply a commodity fiber optic supplier. Essentially, Corning is now in a position to customize its products according to customer specifications. This reduces customer labor and installation costs while dramatically reducing waste. Due to this solutions approach, Corning believes it will be able to continue to expand its profit margin in the Optical Communications segment. This is confirmed below by Dr. Jeffrey Evenson at the Morgan Stanley conference:
we sell solutions, which we have an opportunity to sell at a much higher margin than where we’ve sold in the past in optical. I think a lot of the opportunity for 5G and cloud and the data center space allows us to sell solutions at a much higher margin…
Specialty Materials, Environmental Technologies, and Life Sciences
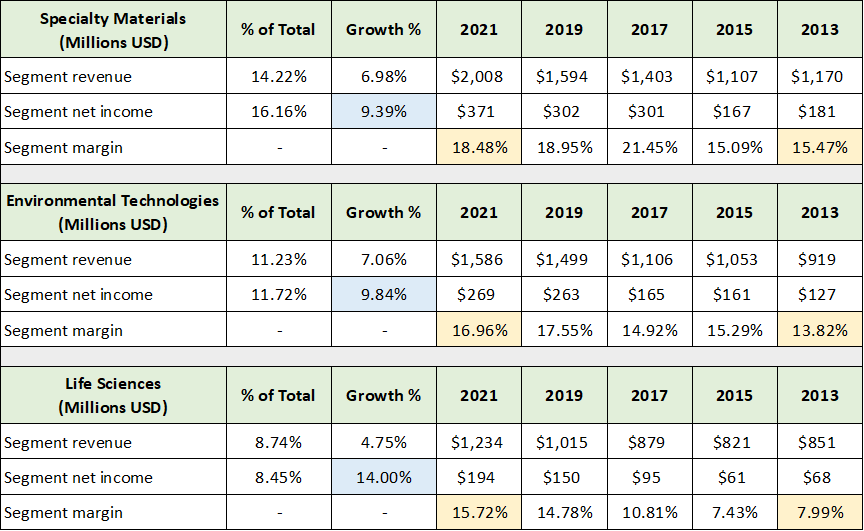
Corning’s two largest business segments are well-positioned for sustainable revenue and profit margin growth. The common technology platform is also enabling a strong growth profile in Corning’s three smaller business segments. The following table was compiled from Corning’s annual reports used above and summarizes the performance across the three segments. I have highlighted in yellow the margin trends and highlighted in blue the annual income growth over the past eight years for each segment.
Source: Created by Brian Kapp, stoxdox
The common theme across each smaller segment is profit margin expansion. Margins look to be stable going forward with the possibility for a continuation of the general uptrend. The Specialty Materials segment includes specialty glass products such as Gorilla Glass, which accounts for 70% of sales in the segment. The Specialty Materials segment offers incredible growth opportunities across a wide swath of industries including the architectural and automotive market alluded to in the discussion of Corning’s technology platform approach.
Environmental Technologies consists primarily of emission control products. The 10% income growth from this segment looks likely to continue given the heightened push for net-zero emissions. While internal combustion engines will lose market share in transportation, the increasing emissions control requirements and emission control usage in hybrid vehicles will continue to support growth.
Life Sciences remains relatively small at 9% of total sales. This is likely to remain the case for some time. That being said, the growth prospects remain robust as highlighted by a recent agreement with West Pharmaceutical Services (NYSE:WST), “West Announces Landmark Collaboration with Corning in Pharmaceutical Injectable Drug Delivery.”
Needless to say, if West Pharmaceutical Services is referring to the relationship as a landmark collaboration, the relative market opportunity for Corning is likely quite large. For reference, West Pharmaceutical is expected to generate $3 billion of sales in 2022 compared to $1.2 billion for Corning’s Life Sciences segment in 2021.
Corning’s materials science technology leadership opens the door to many new drugs and delivery methods that were previously constrained by materials science limitations in regard to drug transport and storage. Growth could surprise on the upside in this segment, which could lead to it becoming a more meaningful contributor to overall sales and profitability. Finally, the Life Sciences segment highlights Corning’s growth strategy of broadening the use cases for its core technology platform.
Hemlock Semiconductor & Other
Corning is achieving incredible growth outside of its five business segments and may be on the cusp of adding a sixth, semiconductors. On September 9, 2020, Corning acquired DuPont’s (NYSE:DD) 40.25% stake in Hemlock Semiconductor, bringing its ownership to 80.5% alongside Shin-Etsu of Japan, which owns the remaining 19.5%. Corning now consolidates Hemlock Semiconductor in its financial statements.
Hemlock, with facilities in Michigan, is a leading provider of ultra-pure polycrystalline silicon to the semiconductor industry. Corning is achieving higher than expected growth from Hemlock resulting from robust semiconductor demand and renewed solar industry growth. These trends are likely to persist through the decade driven by the need to diversify supply chains away from Chinese suppliers and a general trend toward regional supply chains for critical materials.
The stimulative fiscal backdrop in support of onshoring semiconductor and solar manufacturing points toward continued upside surprises. Hemlock Semiconductor is included in the Other segment and accounts for 72% of total segment sales. The following table summarizes the Other segment and was compiled from Corning’s annual reports used thus far.
Source: Created by Brian Kapp, stoxdox
I have highlighted in yellow both total revenue and Hemlock Semiconductor’s share of sales. Please note that Corning consolidated Hemlock in September of 2020 and that I have estimated the 2020* sales for the entire year. The data for 2015*, 2017*, and 2019* represents Corning’s reported equity earnings in Hemlock Semiconductor for each year, rather than sales. The equity earnings suggest that Hemlock is a highly profitable business.
With an exceptionally robust outlook for US semiconductor and solar manufacturing over the coming five years in addition to Hemlock’s 2021 growth at near 53%, Corning may soon need to establish a new semiconductor segment. The historical equity earnings reported prior to the consolidation of Hemlock points toward the potential for material profit growth potential for Corning.
Segment Summary
Including the Other segment, Corning looks to be facing above-average growth opportunities in five of its six business segments. The Display Technologies business offers the least visibility into near-term growth. On the bright side, this segment has an exceptional margin expansion opportunity while screen size trends alone should sustain mid-single digit revenue growth. The Display Technologies segment provides a strong and growing earnings foundation at 42% of total income.
The following table was compiled from the annual reports used thus far and summarizes Corning’s total segment performance over the past eight years. I have highlighted the pertinent detail.
Source: Created by Brian Kapp, stoxdox
Corning’s 8-year revenue growth rate near 8% is a strong showing given weaker end-unit demand conditions over the latter half of this period. Profitability has failed to keep pace but is now reversing upward. As discussed in the segment details, profit margins are on the upswing while revenue growth looks to be robust relative to the historical trend.
Consensus Growth Estimates
With this segment detail in hand, we can now look to consensus growth estimates to discern what the market is currently pricing into Corning’s shares. The following table was compiled from Seeking Alpha and displays consensus earnings and revenue estimates through 2024.
Source: Seeking Alpha. Created by Brian Kapp, stoxdox
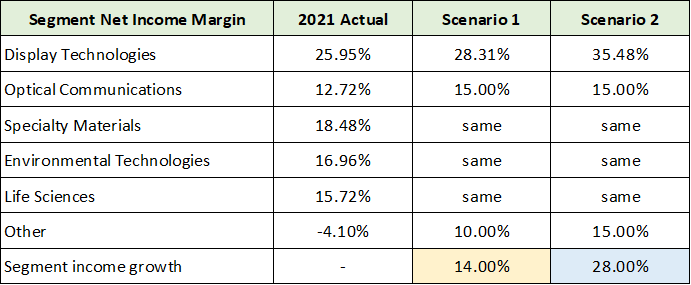
I have highlighted in yellow the estimates that appear to be overly conservative. On the sales growth front, with five of six segments facing above-average growth opportunities, 5% to 6% sales growth looks to be low compared to the 8-year average near 8%. The earnings growth estimates clearly reflect an assumption for material margin improvement. Even in this regard, estimates may be low. To shed light on this, the following table displays Corning’s income growth potential from margin expansion alone under two scenarios for each segment.
Source: Created by Brian Kapp, stoxdox
Scenario 1 looks to be highly achievable given Corning’s more recent history, while scenario 2 remains reasonable, though the segment details would likely differ. Based on the above margin expansion scenarios, Corning could achieve roughly 14% annual growth over several years due to margin expansion alone. Adding sales growth to the mix would then take earnings growth north of 20% using the historical 8% sales growth rate. The likelihood looks to be quite high that Corning will surpass consensus growth estimates through 2024.
Capital Strategy
Corning’s capital strategy adds additional fuel to the upside earnings surprise potential while highlighting the long-term strategic thinking of the company. The added fuel for upside earnings surprises comes from Corning’s $3.5 billion of available share buyback authorization as of the end of 2021. This represents over 10% of Corning’s current market capitalization.
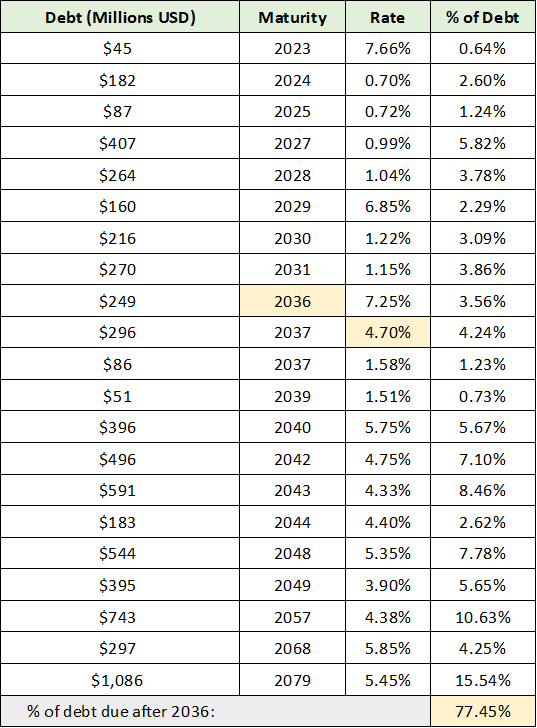
Corning’s strategic long-term capital strategy is on full display in its use of the debt capital markets. The following table was compiled from Corning’s 2021 10-K and lists the company’s debt amount by year of maturity, as well as the interest rate and the bond’s percentage of overall debt.
Source: Created by Brian Kapp, stoxdox
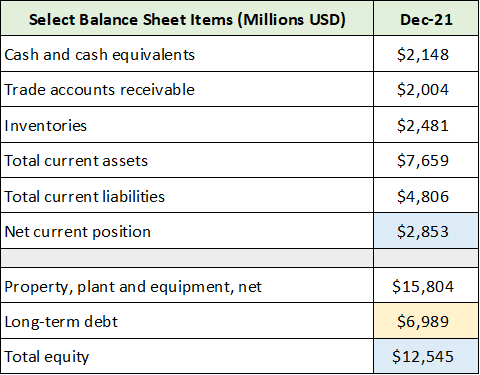
I have highlighted in yellow the key data points. 77% of Corning’s debt matures after 2036 with an average cost of capital near 4.7%. Corning could have financed this capital at much shorter maturities to reduce interest expense, yet it chose not to. This highlights the company’s long-term focus. Locking in long-term capital at historically attractive rates has afforded Corning incredible degrees of freedom in regard to the timing and execution of its capital investment strategy. Total long-term debt is roughly $7 billion and is highlighted in yellow in the balance sheet table below.
Source: Created by Brian Kapp, stoxdox
With nearly $3 billion of net short-term assets after short-term liabilities, and $2.1 billion of cash on hand, Corning’s financial positioning is quite strong. The $7 billion of long-term debt is well covered by property, plant, and equipment and a book value of $12.5 billion. All told, Corning is financially positioned to control its own destiny.
The share buyback authorization of $3.5 billion appears to be a prudent and reasonable capital strategy for Corning. At over 10% of the company’s market value, it can add significant fuel on the earnings surprise front over the coming years. This is especially so when combined with the conservative consensus sales estimates and reserved margin expansion estimates imbedded in consensus growth rates. With the considerable upside surprise potential outlined above, Corning’s current valuation can be placed into greater context.
Valuation
Interestingly, Corning is valued at a steep discount to the general market averages as well as to its peers. The following table was compiled from The Wall Street Journal and Seeking Alpha. It compares Corning’s valuation to the general market averages. I have highlighted in yellow Corning’s valuation data.
Source: The Wall Street Journal and Seeking Alpha. Created by Brian Kapp, stoxdox
Corning is trading at a 19% discount to the S&P 500, a 36% discount to the Nasdaq 100, and a 30% discount to the Russell 2000 based on 2022 earnings estimates. Given that Corning is in the information technology sector and that it has a $31 billion market value, I view the S&P 500 and the Nasdaq 100 indices as each being suitable valuation baselines. In either case, Corning trades at a substantial discount.
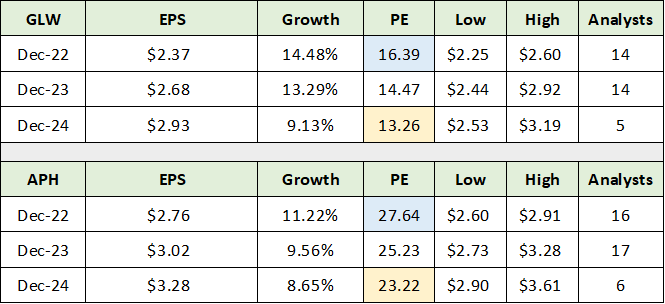
Looking to one of Corning’s most successful peers, Amphenol (NYSE:APH), provides additional color on the extent of Corning’s discounted valuation. The following two tables were compiled from Seeking Alpha and compare the consensus earnings and sales growth estimates for both Corning and Amphenol, as well as their current valuations. I have colored coded the comparable data for ease of contrast.
Source: Seeking Alpha. Created by Brian Kapp, stoxdox
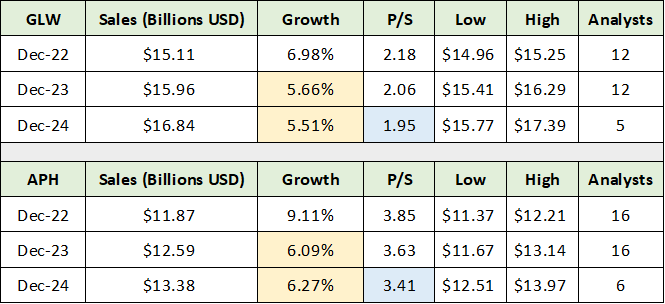
Corning trades at a 41% and 43% discount to Amphenol based on 2022 and 2024 earnings estimates, respectively. Notice that Corning’s earnings growth profile is well above that of Amphenol. The next table compares the consensus sales growth estimates and valuation based on sales for each company. I have colored coded the comparable data for ease of contrast.
Source: Seeking Alpha. Created by Brian Kapp, stoxdox
Corning trades at a 43% discount to Amphenol based on the price-to-sales ratio across all years. Notice that the sales growth estimates are nearly identical. Additionally, as discussed previously, Corning has substantial upside surprise potential to current consensus sales estimates. Corning’s superior earnings growth profile and upside surprise potential in both earnings and sales suggests that the large valuation discount to Amphenol offers an upside opportunity.
Upside Potential
The upside opportunity for Corning shares is well-defined by a relative valuation approach. As mentioned above, Corning is a large cap in the information technology sector which renders both the S&P 500 and the Nasdaq 100 as relevant comparable valuation averages. In the case of its peer group, I view Amphenol as offering a relevant, premium valuation comparison. The following table summarizes the upside potential if Corning is valued in line with these comparables over various period.
Source: Created by Brian Kapp, stoxdox
I view each of these upside scenarios as being quite realistic over a 1-to-3-year time frame. This is especially the case given the upside surprise potential discussed above. If Corning can deliver on upside surprises, these potential return estimates are likely to prove conservative.
Technicals
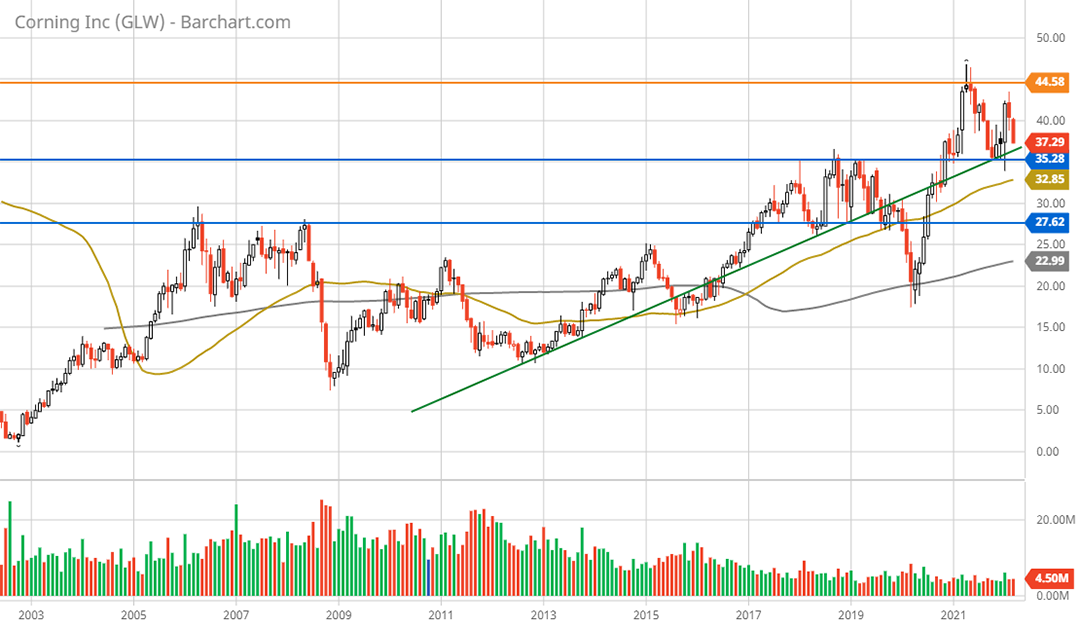
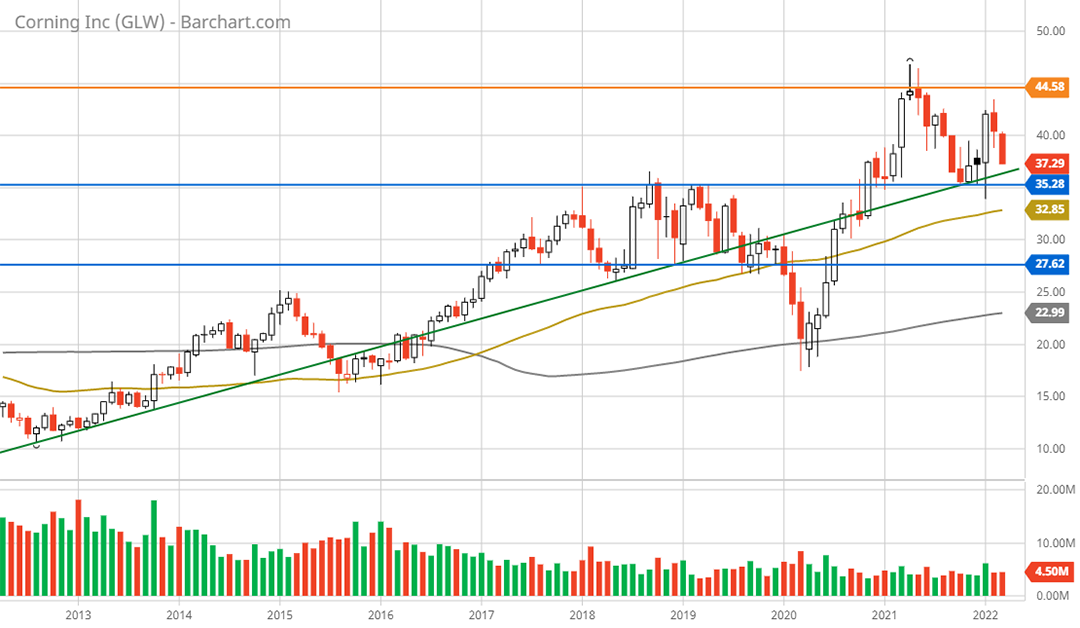
The technical backdrop fully supports the upside return potential outlined above while illuminating the downside potential. What is most striking about Corning’s long-term technical picture is the recent breakout on a monthly basis from a 15-year consolidation pattern. The breakout zone is highlighted by the blue horizontal lines on the 20-year monthly chart below.
Corning 20-year monthly chart. Created by Brian Kapp using a chart from Barchart.com
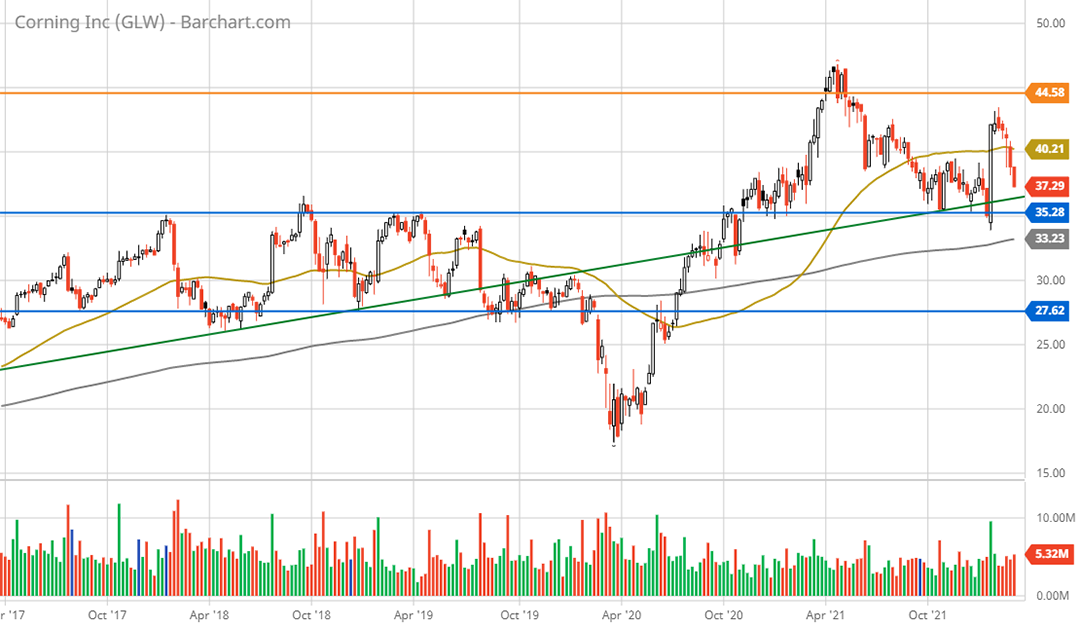
Corning should have incredibly strong technical support within the $28 to $35 range. The breakout above $28 in 2020 combined with surpassing the 20-year high near $35 in 2021 strongly suggests that Corning has entered a new price range within an existing bull market. The decade-long bull market in Corning’s shares is visible in the following 10-year monthly chart. The green line represents the central uptrend line.
Corning 10-year monthly chart. Created by Brian Kapp using a chart from Barchart.com
Corning is currently sitting on the decade-long uptrend line which lies just above the incredibly strong long-term technical support levels. This looks to be an excellent accumulation zone. The following 5-year weekly chart provides a closer look at the recent breakout from the 20-year consolidation which was capped on the high end by the lower blue line. The higher blue line capped the initial breakout attempt in 2018.
Corning 5-year weekly chart. Created by Brian Kapp using a chart from Barchart.com
The $35 to $28 zone looks to be exceptionally solid support and represents downside potential of 6% to 25%. Given the proximity to multi-decade highs near $45, there is no meaningful overhead resistance visible. The absence of technical resistance fully supports the bull market interpretation for Corning’s shares and certainly supports the upside return potential calculated above.
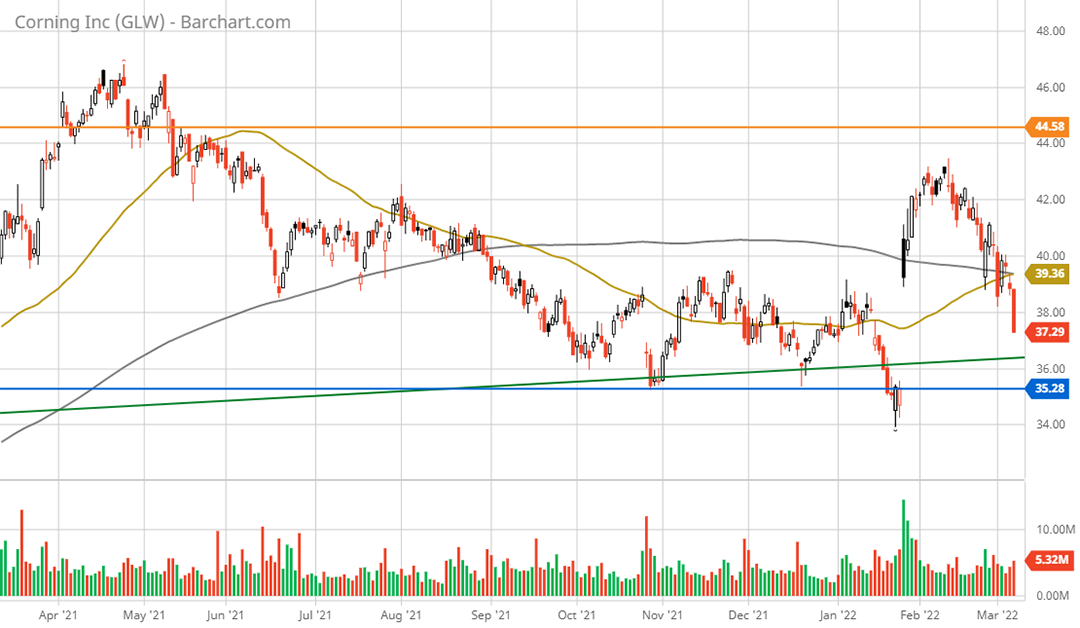
The short-term technical situation turned bullish following Corning’s earnings report on January 26, 2022. The shares gapped higher by 11% in response to Corning’s more upbeat growth projections. The following 1-year daily chart provides a closer look.
Corning 1-year daily chart. Created by Brian Kapp using a chart from Barchart.com
Corning is filling the gap caused by the surprise earnings report. As the saying goes, gaps get filled. Interestingly, Corning has now largely filled the gap while approaching the long-term uptrend line (the green line) as well as the upper end of the strong technical support zone (the blue line).
The technical backdrop for Corning is in bullish alignment across all major time frames with the added benefit of having no technical upside resistance. Being near strong support with no upside resistance is as good as it gets, technically speaking.
Summary
With the technical picture as good as it gets and five of six business segments positioned for above-average sales and margin growth, Corning’s shares are on the cusp of a new bull market. The bull market thesis is further supported by the material margin expansion opportunity in Corning’s largest segment, Display Technologies. Finally, consensus growth estimates look to be well-below established trends and Corning’s visible growth opportunities, adding future fuel to power the burgeoning bull market. All told, Corning offers an asymmetric risk/reward opportunity in an exceptionally high-quality industry leader.
Price as of report: $36.91
Corning Investor Relations: https://investor.corning.com/investor-relations/default.aspx


