Comcast (NASDAQ:CMCSA) offers a unique opportunity in the communications services sector. It differs from Disney (NYSE:DIS) and Netflix (NASDAQ:NFLX) in an important way: substantial and consistent free cash flow generation. The primary operational difference between the three companies is that Comcast owns physical network infrastructure.
Broadband demand should remain firm with natural growth alongside data usage. Looking within the communications services sector, Meta’s (NASDAQ:META) plans for augmented and virtual reality offer a glimpse into future data growth potential. As a result, a key issue for the Comcast investment case is the value of its network.
Risk/Reward Rating: Positive
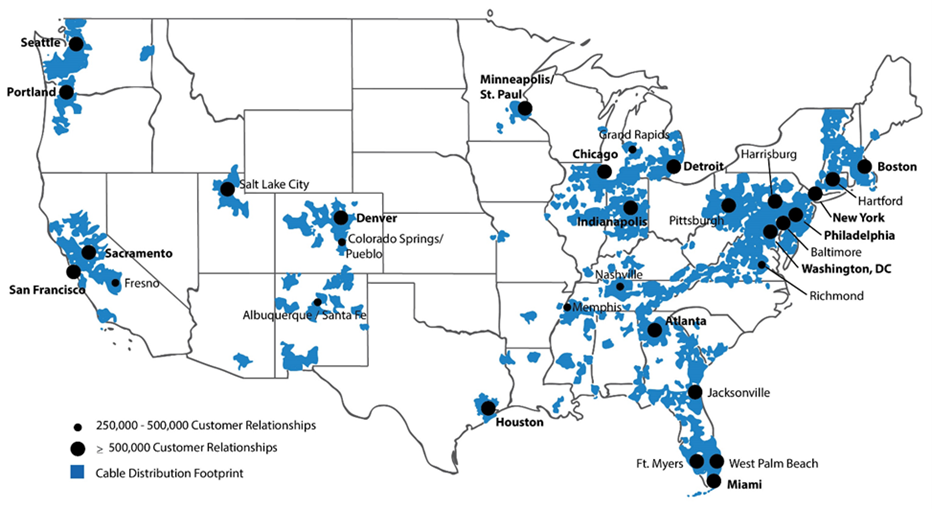
With Comcast trading at a fraction of the valuation of Disney and Netflix, as covered in “Netflix is dancing in the rain,” it is fair to say that the market has deeply discounted the value of Comcast’s network. The following image displays the geographic footprint of Comcast’s broadband network. It is from the company’s 2021 annual report filed with the SEC.
At risk of stating the obvious, it is worth noting that the United States remains the largest economy in the world. A cursory glance at the above map confirms that Comcast would be hard pressed to have a higher value footprint in the United States. The network covers many of the wealthiest geographic regions in the country and spans over 60 million households.
While competition from other network providers is always present, Comcast’s results suggest that its network services are valued in the marketplace. Reliability and service quality are likely to be key differentiators going forward. This is especially true with work from home being the new normal.
Consumers in the above markets will pay premium prices for network reliability and service. The regions are also at the higher end of the market in terms purchasing power. Enhanced purchasing power opens the door to a multitude of communication and entertainment services, such as multiple streaming subscriptions.
Segment Performance
From the perspective of streaming service competition, customers first need a network provider. Comcast is the leading network provider in many of the top US markets, in addition to being a content and streaming company. If legacy cable bundles are viewed as the original streaming services, Comcast is in fact a pioneer.
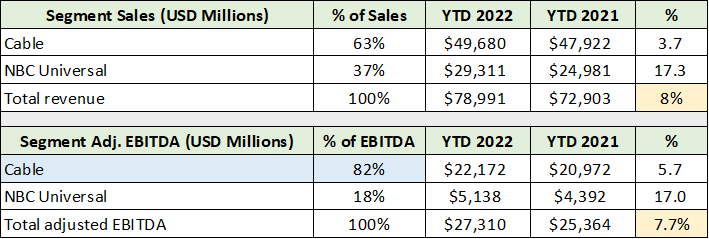
Comcast reports its financial results in two primary segments, Cable and NBC Universal. The legacy cable bundle is reported under Video within Comcast’s Cable segment. This segment also includes Broadband or network services. The following table displays Comcast’s financial results in its two major reporting categories through the third quarter of 2022 and was compiled from its Q3 2022 10-Q filed with the SEC.
Notice that the Cable segment generated 82% of Comcast’s adjusted EBITDA year to date through Q3 (highlighted in blue) while contributing 63% of total sales. The cable operations are clearly the cash flow differentiator when comparing Comcast to Disney and Netflix. Of note, adjusted EBITDA and sales are higher by 8% through the first three quarters of 2022 (highlighted in yellow).
Relative Valuation
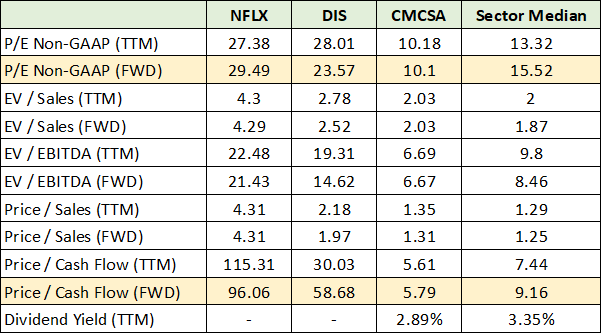
For reference, Netflix is expected to grow sales by 6% in 2022 and by 7% in 2023. Disney is projected to grow sales by 10% in 2023 and by 7% in 2024. As growth rates in the communication services sector are converging, relative valuations are front and center. The following table compares Comcast’s valuation to the sector median, Netflix, and Disney. It is from my December 3 Netflix report.
Notice that Comcast is trading at a third of Netflix’s valuation using forward PE’s and is deeply discounted compared to Disney and the sector median. Comcast’s valuation on cash flow is under 6x compared to 96x for Netflix, 59x for Disney, and 9x for the sector median. The market is clearly discounting negative developments for Comcast in relation to its peers and the communication services sector. Based on the valuations displayed in the above table, it is safe to say that the market is pricing in a relatively bleak future for the company.
Cable Segment
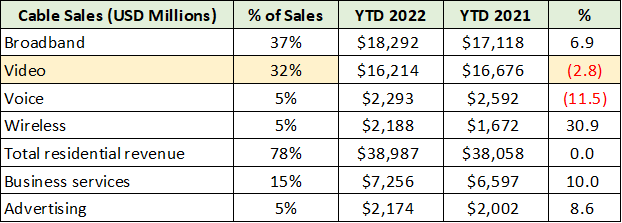
The difference in valuation and thus expectations for Comcast compared to Disney, Netflix, and the overall sector, must be due to its Cable segment as it accounts for 82% of Comcast’s adjusted EBITDA. In the following table, the results of the Cable segment are broken down by service offering. I have highlighted in yellow the primary concern and what is likely driving much of Comcast’s valuation discount.
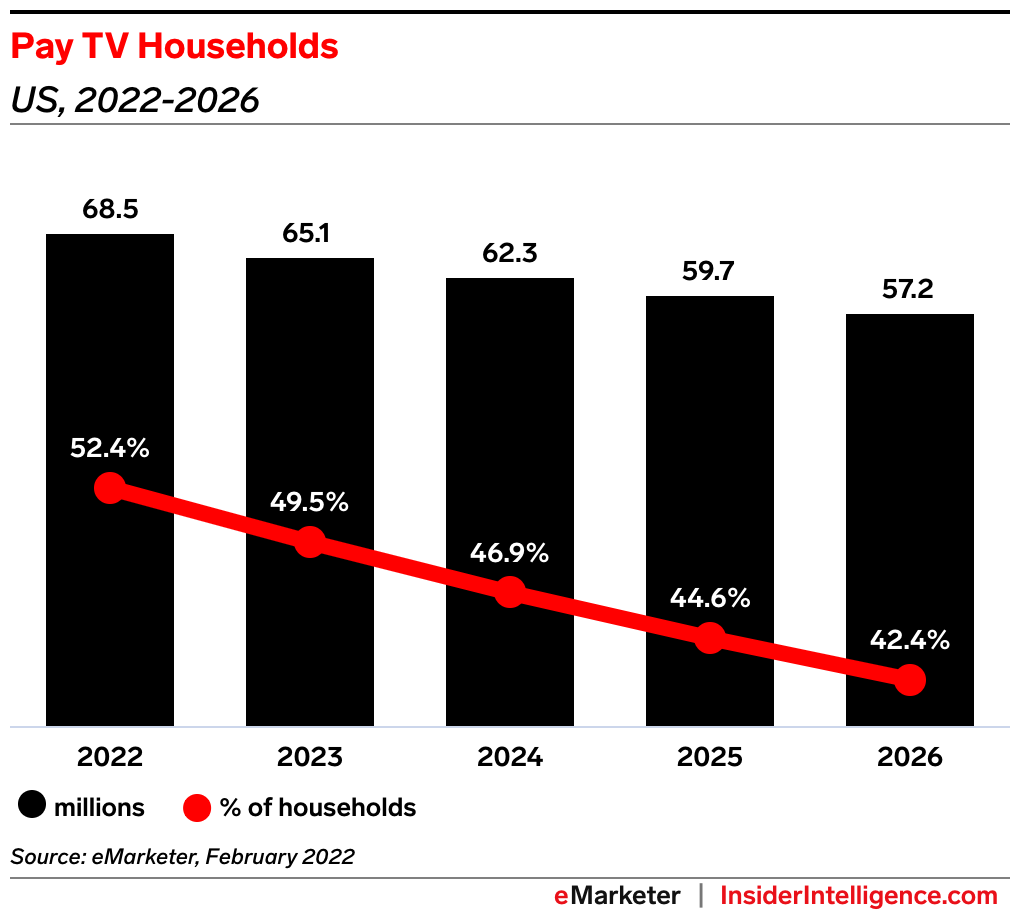
Video or legacy cable bundles account for 32% of sales in the Cable segment and 20% of total company sales (highlighted in yellow). It is no secret that legacy cable bundles are in decline. In a recent article by Sara Lebow of Insider Intelligence, “US pay TV penetration will drop below 50% in 2023,” industry forecasts point to less than half of US households having a traditional pay TV subscription by the end of next year.
What may be surprising in the above table is that the Video decline is less than 3% through the first three quarters of 2022 (the % column). As per the Insider Intelligence article, between 2016 and 2021, pay TV lost more than 50 million adults and over 25 million households. The traditional cable bundle is well advanced in its decline curve. The following image from the article displays an industry forecast through 2026 in millions of subscribers.
Compared to the loss of over 25 million households between 2016 and 2021, 11.3 million additional losses through 2026 would represent a material slowing of the decline to -4.4% per year. For reference, Comcast lost 10% or roughly 2 million Video customers over the past year. The following table displays the Video customer decline and was compiled from Comcast’s Q3 2022 10-Q filed with the SEC.
Recall from above that Video sales declined by only 2.8% while customers declined by just over 10%. For those that remain Video customers, Comcast is successfully raising prices to blunt the decline. All told, the legacy cable bundle decline looks to be nearing a more mature and gradual phase of decline through 2026. The largest customer losses are likely in the rearview mirror, though the decline will continue.
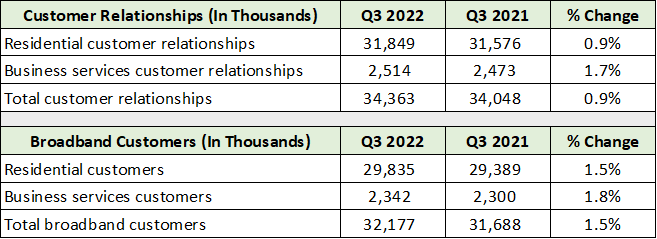
Comcast’s other Cable offerings are offsetting the legacy Video decline. The growth is primarily led by broadband network services, which is Comcast’s largest business line at 37% of segment sales and 23% of total sales. The following table from the Q3 10-Q displays Comcast’s total number of customers and those that are broadband subscribers.
While mild at 1%, Comcast is growing its total customer base. The company’s network includes over 61 million homes and businesses. At over 34 million customers, Comcast has penetrated 56% of the market in its Cable segment. Its Video services are now down to 27% market penetration with 16.5 million customers. As cable bundles are expected to fall below 50% penetration of US households in 2023, Comcast’s Video losses should begin to slow as market penetration is now down to 27%.
Pricing
With a stable outlook overall on the customer front, the question becomes one of pricing power and number of services delivered to customers. Pricing is now the dominant variable for success across the communications services sector and streaming services, as discussed in “Has the magic returned to Disney?” From the report:
As a result of its rapid market penetration, Disney is highly likely to experience a material slowdown in subscriber growth over the coming years as it transitions to a more mature growth phase. As is the case with Netflix today, future success will become more dependent on pricing power.
To provide a reference for Comcast’s pricing, Netflix’s average price per subscriber is $16.37 per month in North America while Disney+ averages $6.34 per month. The following table displays Comcast’s average monthly price per customer and was compiled from its Q3 10-Q filed with the SEC.
Compared to Netflix and Disney’s streaming services, Comcast’s Cable segment resides in a different universe at over $160 per month. While Comcast’s pricing is much higher and is somewhat constrained compared to Netflix and Disney, its pricing power is still expanding. Importantly, profitability per customer is growing more rapidly than pricing, at 4% versus 1.3%.
Multiple Services
The number of services provided per customer has been falling due to the structural decline in cable bundles and traditional voice services (landlines). This will be important to monitor going forward in combination with Comcast’s Peacock streaming service, which has reached 18 million customers. The Peacock streaming service is reported within the NBC Universal segment under Media and is not a component of the Cable segment’s customers as outlined above.
The number of services provided to each Cable segment customer is detailed in the following table compiled from Comcast’s Q3 10-Q. All customers require network access which bodes well for Comcast’s broadband services into the future.
Furthermore, Comcast is on the brink of a major network transformation over the coming four to five years, which will achieve a material expansion of two-way data transfer capabilities. As we will see with the coming Meta update, such service capabilities are a requirement if virtual and augmented reality are to enter the mainstream at full potential.
With the coming wave of innovation, Comcast’s network should become increasingly valuable to consumers and businesses alike, while expanding the opportunity set for new services. As mentioned at the outset, reliability and service quality are likely to be key differentiators going forward. This is especially true with work from home being the new normal. Consumers will increasingly desire “five-nines” reliability and peak performance as a matter of necessity.
NBC Universal
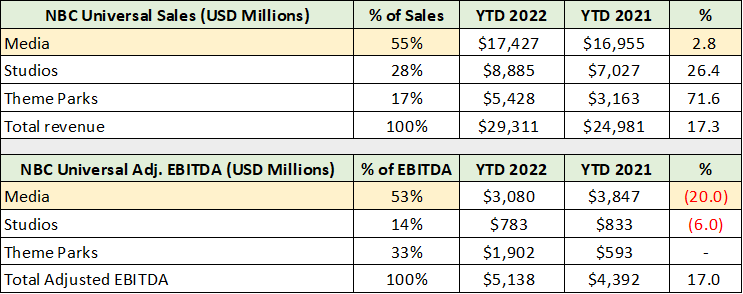
The Comcast investment case is unique in that it has a communications utility in top markets at its core, combined with leading brands and media content globally. As discussed above, Comcast reports its streaming services under Media in the NBC Universal segment. Media accounts for 55% of total sales in the segment.
Please keep in mind that the entire segment contributes only 18% of total EBITDA while producing 37% of sales. The other units in the segment are Studios and Theme Parks which together account for a rather small 10% of total EBITDA. The following table displays the financial results of each unit within NBC Universal through the first three quarters of 2022.
I have highlighted in yellow the results in the Media business unit. The 20% decline in adjusted EBITDA is in line with industry trends, as the launch of streaming services are a drag on profitability. Interestingly, Comcast derives surprisingly little of its sales from streaming services, which accounted for 1.7% of total company sales year to date.
The Peacock streaming service generated $1.4 billion of revenue in the first three quarters of 2023 compared to $443 million through Q3 of 2021, a 216% increase. Comcast now has 18 million Peacock subscribers in addition to its 23 million Sky customers within the NBC Universal segment. When added to its 34 million Cable segment customers, Comcast’s reach is large, global, and expanding.
While streaming is an important growth factor in the Comcast investment case, it is unlikely to become material to its overall financial results for some time. Furthermore, it is not clear that the Comcast investment case is fundamentally altered by the changing video consumption patterns of consumers.
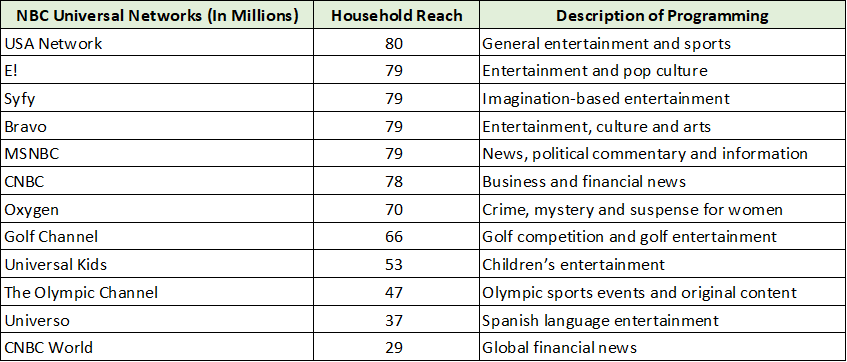
Whether video is preferred as a cable bundle or consumers prefer to bundle various streaming services themselves, Comcast is well positioned to deliver. The following table displays NBC Universal’s brands and household reach.
The above list could form the foundation for any number of successful streaming packages. Other important brands include Universal, NBC, Telemundo (Spanish language), and Sky (Europe).
At a time of depressed valuations in the media space, Comcast is entering an opportunity-rich environment given its large and stable cash flow. Through the first nine months of 2022, the company produced roughly $11.3 billion of free cash flow. Comcast has produced over $14 billion of annual free cash flow since 2018, defined as cash flow from operations minus capital expenditures.
For example, AMC Networks (NASDAQ:AMCX) recently eliminated 20% of its workforce and is trading at an all-time low. Its enterprise value is in the mid-$3 billion range. AMC’s unique content and audience could add material breadth and depth to Comcast’s offerings, while amplifying its pricing power when combined with existing content and brands. AMC also has over 11 million streaming customers of its own. The opportunity set is expanding for Comcast.
Consensus Estimates
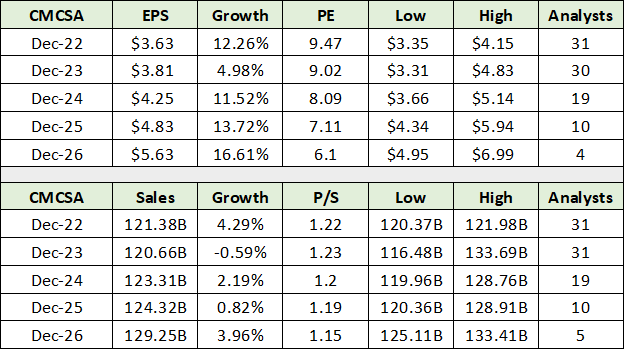
With all the pieces in place for steady long-term success and visible growth potential, the question turns to valuation and consensus estimates. The following table was compiled from Seeking Alpha and displays recent consensus earnings and sales forecasts for Comcast.
Earnings growth in the mid-teens combined with a single-digit PE suggests that the market is pricing in a material earnings disappointment through mid-decade. This conclusion is supported by the fact that Comcast is trading at a deep discount to its 5-year average PE of 15x earnings.
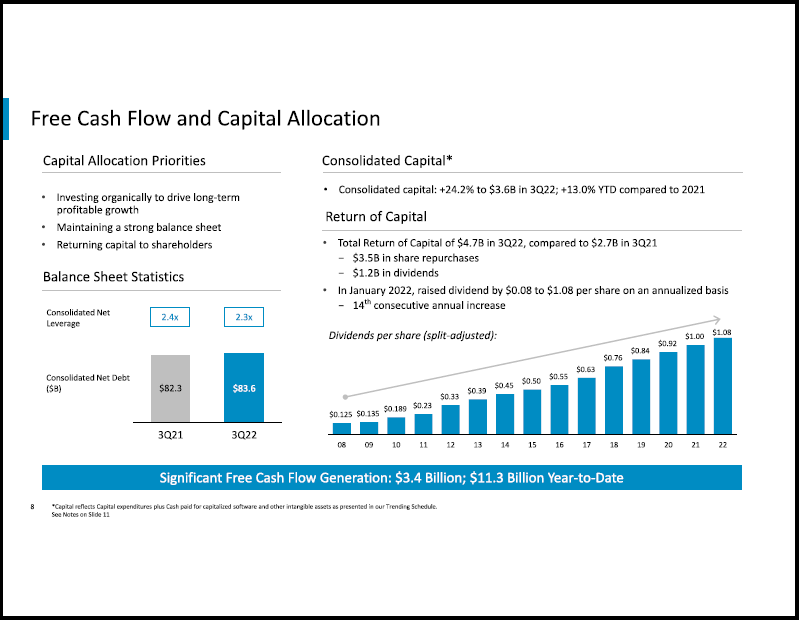
Interestingly, consensus earnings estimates look quite achievable when considering Comcast’s active share repurchase program. The company bought back $3.5 billion of its shares in Q3 2022 alone, with an annualized free cash flow run rate of $15 billion. This represents a 10% free cash flow yield on the current share price. The forecast for sales to stagnate through mid-decade also looks conservative and should offer upside surprise potential.
A valuation reversion to Comcast’s average 15x earnings looks to be a reasonable upside target. Using the 2024 consensus estimate, the target of $64 represents 85% upside potential. The 3% dividend is additive and offers substantial income growth opportunity from a relatively low payout given the 10% free cash flow yield. Comcast has an impressive history of growing its dividend as can be seen in the following image from its Q3 2022 earnings presentation.
Given Comcast’s utility-like features and downside valuation support at a single-digit PE, the return asymmetry is decidedly skewed to the upside.
Technicals
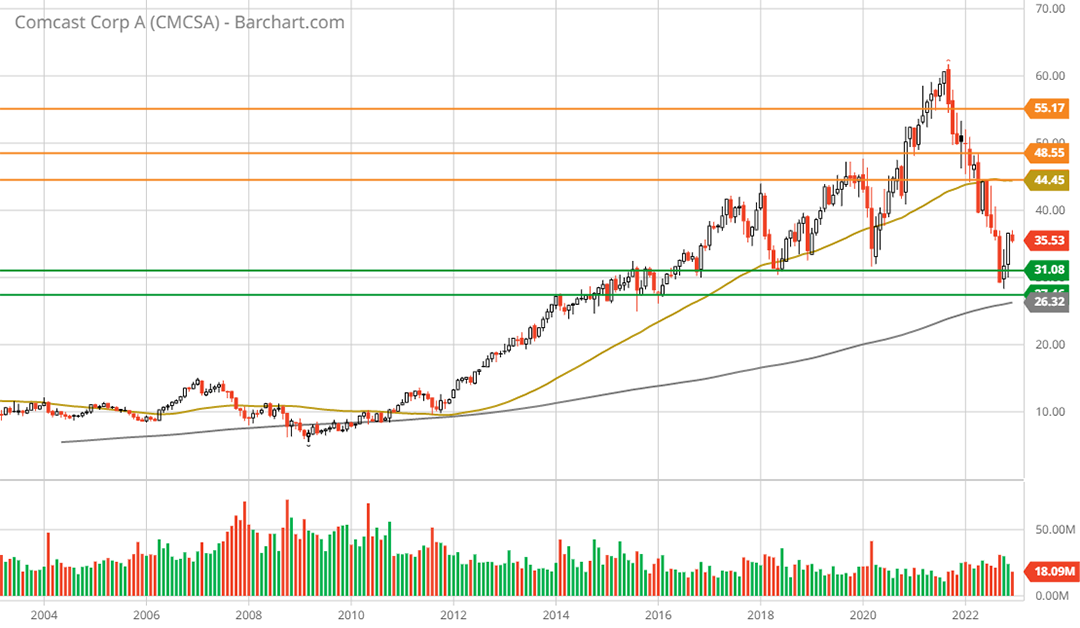
The technical backdrop mirrors the fundamental upside asymmetry. The following 20-year monthly chart offers a long-term view. Recall that legacy cable bundles lost over 50 million adult customers and 25 million households between 2016 and 2021. The sideways price action or consolidation since 2016 makes sense in this context.
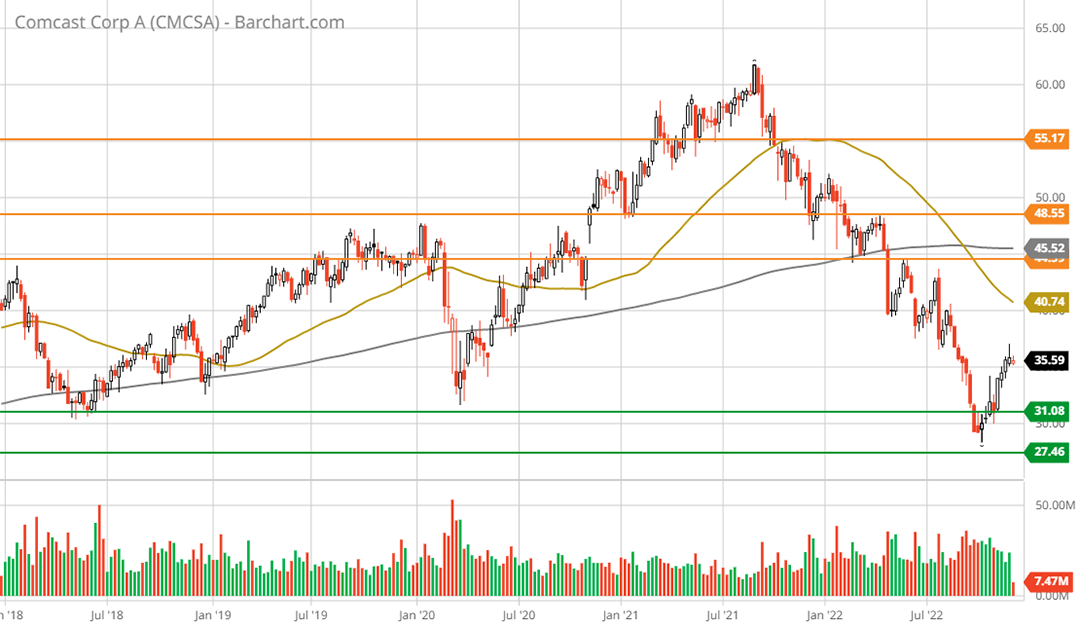
The green horizontal lines represent a long-term support zone dating back to 2014. The shares recently tested this support zone, the lower end of which is near the 200-month moving average (the grey line). Nearing the 200-month moving average is the definition of technically oversold from a long-term perspective. The following 5-year weekly chart provides a closer look.
Comcast’s all-time high near $62 is in line with the fundamental price target of $64 based on 15x the 2024 consensus earnings estimate, or Comcast’s 5-year average PE. Note that the orange horizontal lines bracket the primary technical resistance zone from $45 to $55. The technical backdrop shows little resistance until the $50 range, with moderate resistance through all-time highs.
Summary
Sitting on long-term support dating back to 2014, the technical risk/reward asymmetry is decidedly skewed to the upside. With the technical and fundamental backdrops aligned, Comcast stands out as a uniquely asymmetric risk/reward opportunity.
Trading at 8x the consensus earnings estimate for 2024, the market appears to be pricing in a worst-case scenario for Comcast’s Video services or cable bundle business. Interestingly, Comcast survived the 2016 to 2021 ‘cord-cutting’ tsunami of over 25 million households intact. With offsetting growth opportunities and the worst behind it, the downside has been priced in creating a high-quality asymmetric risk/reward opportunity.
Price as of this report: $34.62
Comcast Investor Relations Website


