Risk/Reward Rating: Negative
Chewy (NYSE: CHWY) reported Q2 2021 earnings after the market closed on September 1, 2021. The results were solid, however, the guidance for the remainder of the year disappointed investors sending the shares down over 9% the following day. The company is now projecting sales growth of 26% for fiscal 2021 (the fiscal year ends January 31, 2022). This is a rapid deceleration in growth compared to the 47% sales growth registered in fiscal 2020.
Revenue Growth and Overview
Chewy was a large COVID beneficiary as the economic shutdowns caused pet owners to increasingly purchase their supplies online. Consumers were already turning to online pet care purchases well before COVID as evidenced by Chewy’s 37% revenue growth achieved in 2019. Based on the 26% revenue growth forecasted for the current year, it is safe to say that COVID expedited or pulled forward online pet care penetration in an otherwise robust adoption trajectory. It is increasingly likely that the outsized 47% growth in 2020 will now be offset by more modest growth rates in 2021 and 2022, followed by a naturally declining growth trend as the online pet care market matures.
The pet care industry is an attractive investment opportunity as it is growing at rates well above the overall economy and displays secular rather than cyclical growth characteristics. Society increasingly treats pets as family members rendering their care a necessary rather than a discretionary expense. Furthermore, Chewy aspires to become the go-to platform for all things pet care for both consumers and veterinarians. Essentially, Chewy plans to become the marketplace as well as the supply chain backbone for the pet care industry. Given the positive industry backdrop and Chewy’s bold strategy, the shares are a worthy investment consideration.
Financial Results: Income
Like many online sellers, Chewy has been successful in generating revenue growth while sacrificing profitability in the process. As we will see, the sustainable profitability and cash flow generation of the business model will form the crux of the investment case for the company. The following table was compiled with data from Chewy’s most recent 10-K (annual report) filed with the SEC (years 2018 through 2020) as well as the Q2 shareholder letter (the 2021* column is the high end of the company’s annual guidance from the letter).
The revenue growth figures are impressive, although, as shown in the table, are now in a decelerating trend. However, Chewy’s profitability is less than impressive. As can be seen in the bottom row, the company has generated large GAAP (generally accepted accounting principles) losses historically. It appears likely Chewy will report a loss for 2021 as well, however, the company did report GAAP net income of $22 million through the first half of the year.
Chewy does not provide GAAP income guidance as they are unable to forecast certain expenses accurately. Instead, Chewy provides adjusted EBITDA (earnings before interest taxes depreciation and amortization) guidance which is a non-GAAP measure of operating profits that requires some care and nuance in its interpretation.
On this measure, Chewy is expecting to produce $108 million of adjusted EBITDA for the full year in 2021. The growth rate at just under 27% is in line with the projected revenue growth rate. Caution is required in using Chewy’s adjusted EBITDA to gauge profitability as it excludes stock-based compensation expense. This expense (paying employees with stock rather than cash) has been material, coming in at $129 million last year.
Additionally, given that Chewy is building out a sizeable distribution network of warehouses and fulfillment centers, real world depreciation of such assets occurs over time through the natural wear and tear of day-to-day operations. As a result, ignoring depreciation in its entirety may not reflect the underlying economic reality. Nonetheless, given the current $33 billion market value of Chewy’s stock, the valuation stands at 306x adjusted EBITDA, which is extremely high.
Financial Results: Cash Flow
Due to the limitations of adjusted EBITDA discussed above and the lack of GAAP net income profitability, a review of the cash flow generation of Chewy will help shed some light on the underlying business model. The following cash flow table was created using the cash flow statement in the company’s most recent 10-K annual report (2018 through 2020) and the recent 10-Q (second quarter financial report) filed with the SEC. The 2021* column is data for the first six months of 2021 while the remaining columns are the cash flows for the full year.
The first thing to jump off the page is the $183 million of cash flow from operations generated through just the first six months of 2021. When compared to the preceding full years, this looks to be an impressive improvement.
The free cash flow through the first six months is even more notable coming in at almost $120 million compared to near free cash flow breakeven in the prior two full years (free cash flow is cash flow minus capital expenditures). The cash flow performance is extraordinary through the first six months of 2021 compared to the historical annual performance, as well as in comparison to the company’s adjusted EBITDA estimate for the full year of 2021 of only $108 million (discussed above).
Another item that stood out on the cash flow statement through the first six months of 2021 was the large swing in inventory investment compared to prior years. In the cash flow table above, a negative figure for inventory investment reflects an investment in inventories or inventory growth. Likewise, a positive figure indicates that the company is not making inventory investments and that inventories are contracting.
Chewy historically has grown inventories alongside sales but this stopped through the first six months of 2021. This is unusual with sales growth coming in at 26%. Furthermore, it is unusual with capital expenditures running at 2-3x the levels of 2018 and 2019 with much of this being spent on physical structures to receive and process inventory (warehouses and fulfillment centers).
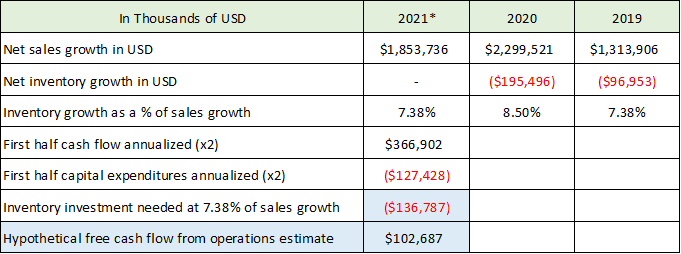
Given the lack of GAAP profitability and the meager adjusted EBITDA compared to the $33 billion market value of Chewy, the cash flow generation of the business model takes on a heightened importance for the Chewy investment case. If cash flow capability really is expanding rapidly, it could help bolster the case given the lack of support from GAAP profitability and adjusted EBIDTA. The following table combines data from the income and cash flow tables above to illuminate the sustainable cash flow situation.
What is shown in row one is the year-over-year growth of absolute dollar sales. Row two shows the year-over-year investment in more inventory for years 2019 and 2020. In order to extrapolate an inventory investment estimate for 2021, I assume Chewy will need to invest in inventory to support sales as it has done historically and that for the full year of 2021 the investment is the same percentage of revenue growth that it was in 2019 (7.38%).
For clarification, in 2019 Chewy invested an additional $97 million in inventory to support an additional $1.3 billion of sales. For the 2021* column in the above table, I assume that Chewy will need to make the same inventory investment as a percentage of sales growth as it did in 2019 at 7.38% of sales growth (sales growth for 2021 is based on the $9 billion sales guidance provided by management). My estimated inventory investment can be found in the second row from the bottom shaded in blue.
The assumption that inventory investment must grow with sales makes sense as Chewy does not book revenue until the product is shipped to the end customer. As a result, although Chewy serves as a middleman in the transactions on its platform and thus has low inventory requirements, Chewy must manage the inventory throughout its network between its purchase from the manufacturer until it is shipped to the customer.
Based on this inventory assumption, the estimated full year inventory investment required by Chewy to support its sales guidance of $9 billion for 2021 ($1.85 billion growth over 2020) equates to a net new inventory investment in 2021 of $136.8 million. Recall that the company actually reduced inventories through the first six months of 2021 by $7.3 million which materially inflated the cash flow and free cash flow from operations through the first half of the current year. If we annualize the first half cash flow and capital expenditures and deduct the estimated need to invest $136.8 million into inventories in the second half of the year (without adding an additional $7.3 million to account for the first half reduction), we arrive at a hypothetical free cash flow from operations estimate for 2021 of $102.7 million (final row highlighted in blue).
Summary of Financial Performance
Circling back to the investment thesis for Chewy stated at the outset of the financial overview, the sustainable profitability and cash flow generation of the business model will form the crux of the investment case for Chewy. The result of the cash flow analysis above points to an estimate of free cash flow for the year in the ballpark of $102.7 million. Management does not provide guidance in this regard. The adjusted EBITDA guidance for 2021 provided by the company is for $108 million. This is remarkably close to the free cash flow estimate reached in my analysis of the cash flow statement. Given the lack of GAAP profitability, these two figures are the best estimates for the underlying profitability of the Chewy business model as it stands today.
Valuation
Based on the above free cash flow estimate of $102.7 million and the $108 million of adjusted EBITDA guided to by management, Chewy is currently valued at 322x my free cash flow estimate and 306x management’s adjusted EBITDA estimate for 2021. These are extreme valuations from a historical market perspective. As a reference to current market valuations, large companies today, on average, are trading in the range of 22x to 29x earnings estimates for 2021 and smaller companies are trading around 32x earnings estimates (using the S&P 500, the Nasdaq 100, and the Russel 2000 indices).
On a price-to-sales basis, Chewy is trading at 3.7x expected sales. While this is not extreme on an absolute basis, it is elevated for a business model like Chewy’s. The company is operating in a low margin business similar to retailing. It is common for price-to-sales valuations for such businesses to land on both sides of 1x sales depending on the quality of the business. Chewy’s aspiration to become a platform backbone for the pet care industry would elevate it out of this low valuation-to-sales neighborhood if it can execute on this plan longer term.
To provide more context for viewing the current 3.7x sales valuation for Chewy, we can look at the sales valuation of Amazon. Amazon is a mixture of extremely high-margin businesses (like the Amazon Web Services division) and low-margin businesses (their retail sales and third-party seller platform which is more similar to Chewy’s business model). Keep in mind that the Amazon brand is a dominant global brand so one would expect it to receive a high valuation premium compared to most other companies. Amazon is currently valued at 3.5x sales estimates (10-K and 10Q) compared to Chewy’s valuation of 3.7x sales. Remember, Amazon’s valuation is a mixture of remarkably high-margin businesses (unlike Chewy) and low-margin businesses like Chewy’s. As a result, one would certainly expect the Chewy valuation multiple to be at a substantial discount to Amazon’s 3.5x total sales.
Summary
Chewy is a great company and is doing an excellent job of penetrating the pet care market and growing revenue. That said, at the current valuation the risks outweigh the rewards. Given the bright outlook for the industry and Chewy’s larger aspirations, the company deserves a spot on the watch list for a potential purchase. A substantial share price decline could open the door for a more attractive entry point which offers a greater margin of safety and more opportunity for prospective investors. The charts will help identify where these opportunistic entry points may be located.
Technicals
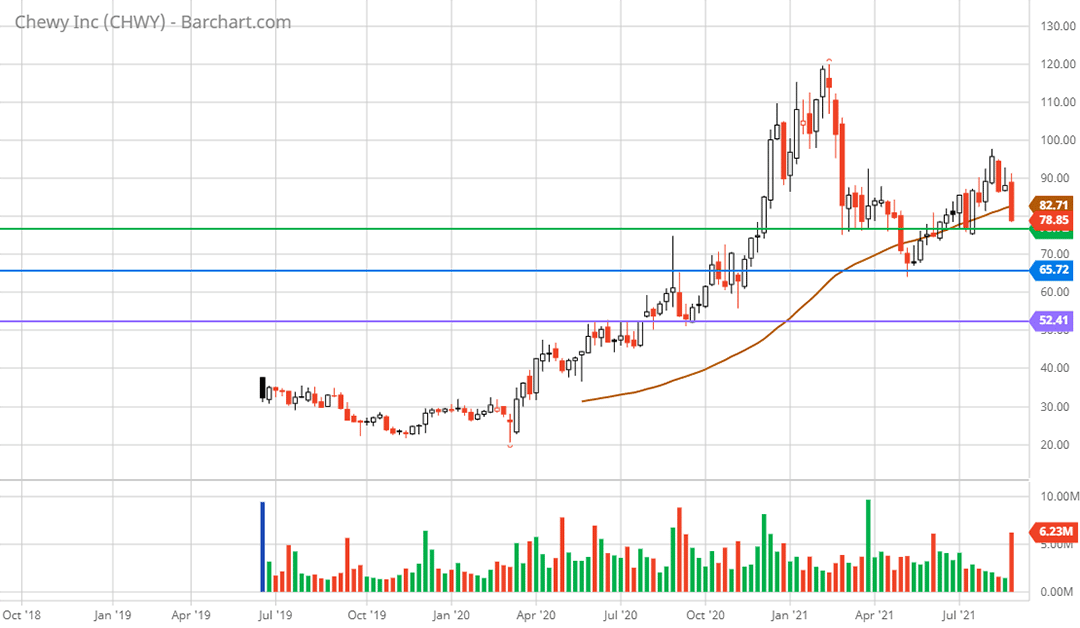
Technical backdrop: Chewy came public in June of 2019 in the $34 area and proceeded to trend lower before reaching a bottom at $20 in March of 2020. Given the boost to online sales, the stock skyrocketed and topped out at $120 in February of 2021. The crash from the peak was remarkably quick as the stock collapsed 37% over just three weeks into the first week of March 2021. The weekly chart below places these events in context.
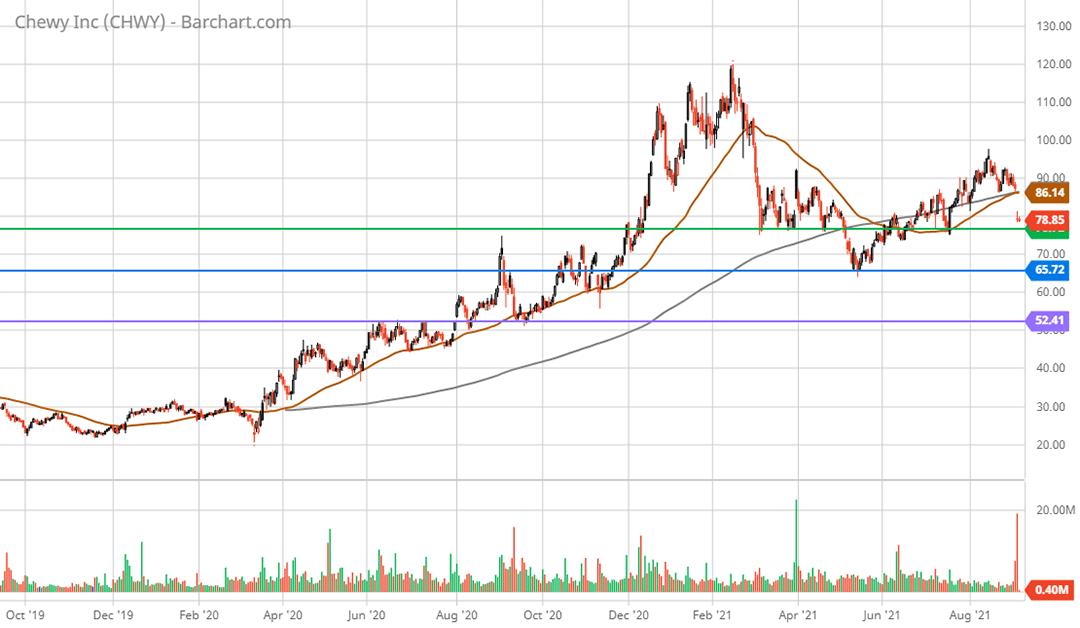
The stock finally found a weekly bottom near $67 in May of 2021 and staged a countertrend rally to $95 that peaked in August and was accelerated lower by the 9% price drop following the Q2 earnings report. As can be seen by the colored horizontal lines, Chewy has three critical support levels that are likely to face a test. These support levels are drawn from the following daily chart.
The stock is closing in on the first critical support area near $75 (green line). This has served as support for much of 2021 outside of the break lower to $65 in May. Given the valuation reality, this is likely to be tenuous support and the repeated testing of it throughout the year suggests a break lower is likely. The $65 low from May is also a key support zone (blue line) as this was an area of resistance between September and December of 2020. Given the price churn and time spent in this area last year, this level should offer more firm support.
It should be noted that the 50-day moving average (brown line on the daily chart) crossed beneath the 200-day moving average (grey line on the daily chart) on May 24, 2021, forming what is called a ‘death cross.’ This suggests a primary downtrend is in place. The 50-day moving average remains beneath the 200-day moving average confirming the current down trend signal.
Given the lack of valuation support at the first two support levels, it appears that the third lower support level will also be tested near $52 (purple line). This served as a sideways churn and resistance zone from June to August 2020. This third support level looks to be the first potentially opportunistic accumulation zone for the shares.
Technical resistance: $86 should offer stiff resistance as it was the price before the gap lower on the Q2 2021 earnings report. The stock should face resistance throughout the gap up to $86 as well.
Technical support: The three primary nearby support levels are $75, $65, and $52. The $52 support zone looks to be on the table.
Price as of this report 9-3-21: $79.33
Chewy Investor Relations Website: Chewy Investor Relations
Data in this report is compiled from the Chewy investor relations website and SEC filings, and where applicable publicly available information regarding consensus earnings estimates.


