Risk/Reward Rating: Positive
B2Gold stock has been ravaged over the past year, falling 50% from its all-time high in August 2020. The move lower is in line with the gold mining sector which has been out of favor throughout the past year. Over the same period the price of gold has fallen just 13% from the all-time high reached in August 2020. The amplitude of the fall in B2Gold’s share price compared to that of the gold price is what is known as beta and gets to the crux of the investment case for B2Gold and other gold miners.
High Beta Gold Investment
If one expects the price of gold to trend higher, gold miners are a high beta or levered way to invest in this expectation. For example, if gold makes a move to the all-time high of last year, the price gain will be 15%. On the other hand, if B2Gold follows suit and reaches its high of last year, an investor would achieve a return of 100%. The extraordinary difference in return potential is worthy of consideration, especially following a large price decline in gold miners.
In a bullish gold price scenario, the return potential can become quite impressive. For example, many analysts who are bullish on gold foresee $2,500 per ounce as the next upside target if new highs are reached. Under these conditions, the earnings potential of B2Gold will grow rapidly. The current estimate for 2022 at $1,800 per ounce gold is for B2Gold to earn $.44 per share. Under a $2,500 gold regime, earnings estimates would likely rise to the $1.48 per share area. Thus a 38% rise in the price of gold would translate into a 236% increase in the earnings potential of B2Gold.
Under this hypothetical bull case of $2,500 gold, assuming $1.48 per share of earnings for B2Gold, the upside possibilities are quite large for the shares. Looking at various theoretical price to earnings (PE) multiples (10,15, and 20), the share price under each PE would be $15, $22, and $30, respectively. This then translates into a return potential off the current share price ($3.88) of 285%, 478%, and 670% respectively.
This is a hypothetical scenario used to illuminate the high beta nature of gold miners to the price of gold. The beta works upward and downward as has been seen over the past year and highlighted in the opening paragraph.
Valuation
From a valuation standpoint, B2Gold is currently trading at 9.24x 2021 estimated earnings and 8.84x 2022 estimated earnings. These are incredibly low PE multiples in today’s hyper-valued markets and stand at nearly one-third of the prevailing market-wide averages (depending on the comparison index). The attractive valuation gains further appeal from the annual dividend which equates to a 4.12% yield at the current price.
It should be noted that B2Gold has a strong balance sheet with only $62 million of long-term debt and $382 million of cash, along with an undrawn credit line of $600 million. The strong financial position and $1 billion of liquidity (cash plus credit line) provide the company with optionality for future growth should attractive projects become available.
Operations Overview
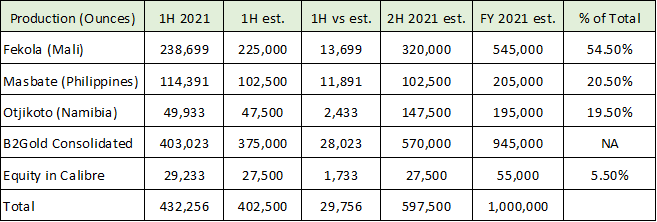
B2Gold is a large gold producer and expects to produce one million ounces of gold for the full year in 2021. Like much of the mining industry, B2Gold carries its fair share of geopolitical risk as many mines are situated in emerging market countries. In the case of B2Gold, Mali houses its largest mine which is considered ‘world-class’ and produces over half a million ounces per year. The following table breaks down B2Gold’s operational results through the first half (1H) of 2021 and the company’s expectations for the full year by mine.
The company has surpassed gold production estimates by 7.4% through the first half of 2021. The Fekola mine in Mali is B2Gold’s key asset at the moment. There are nearby expansion plans for the operations which are running into some local permitting issues. These types of issues fall under the geopolitical risk category and are common in the industry. Other expansion permits nearby are in good standing and the hope is the remaining issues can be resolved. The region is rich in resource potential and offers excellent growth prospects.
The company has an active exploration program and other defined growth projects in the pipeline. B2Gold has a successful track record in exploration and the associated acquisition of low cost, highly economic mining prospects. In fact, the highly economic mining operations and track record is a defining characteristic of B2Gold to date.
Gold Technicals
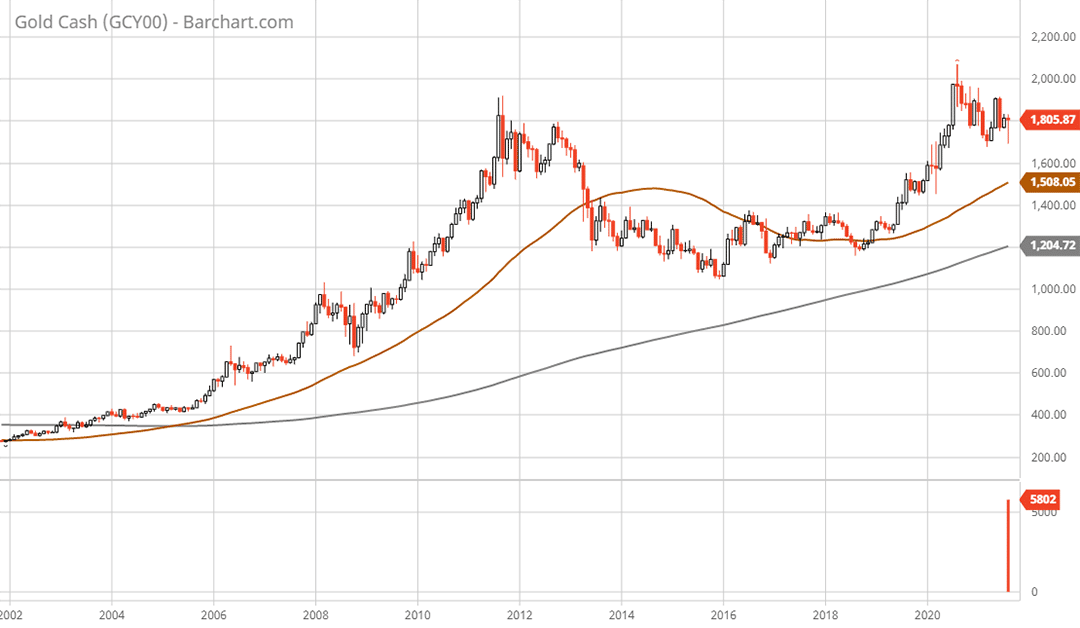
Technical backdrop: The Gold price has formed a 10-year cup and handle pattern which is normally construed as a bullish formation (see the 20-year monthly gold chart below). The highest monthly closing price for gold prior to 2020 was $1,825 per ounce in August 2011. The price then entered a bear market and consolidation pattern before resuming an upward trend in June 2019. Gold set a new all-time monthly closing high of $1978 in August 2020 after breaching the $2,000 level for the first time. The new high compared to 2011 lends credence to the bullish interpretation of the 10-year cup and handle pattern. Gold has been in a shallow corrective phase for the past year with a monthly low of $1700 in March 2021. The long-term technical backdrop for gold looks bullish.
B2Gold Technicals
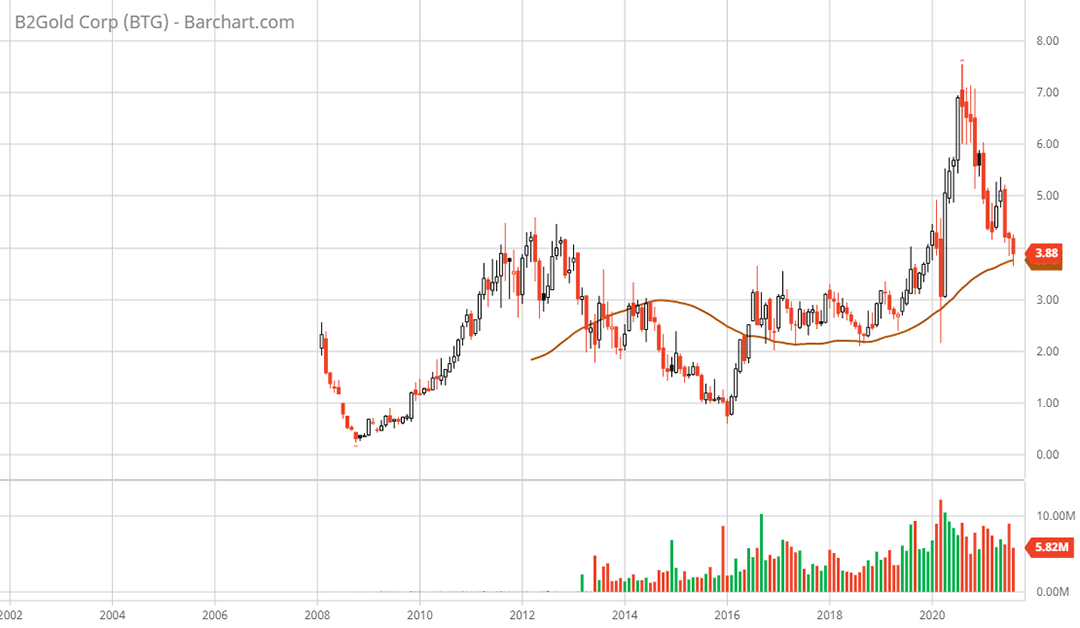
Turning to the B2Gold monthly chart, the price is currently sitting on the 50-month moving average (brown line on the monthly chart below). This level coincides with the peak reached in 2011 and 2012 when the price of gold last topped out. B2Gold did not have the gold production and earnings in 2011 and 2012 that it has today. The stock is also nearing prior monthly tops in the $3.20 area reached between 2016 and 2019, which was during a much lower gold price environment. These prior tops should serve as solid support for the shares.
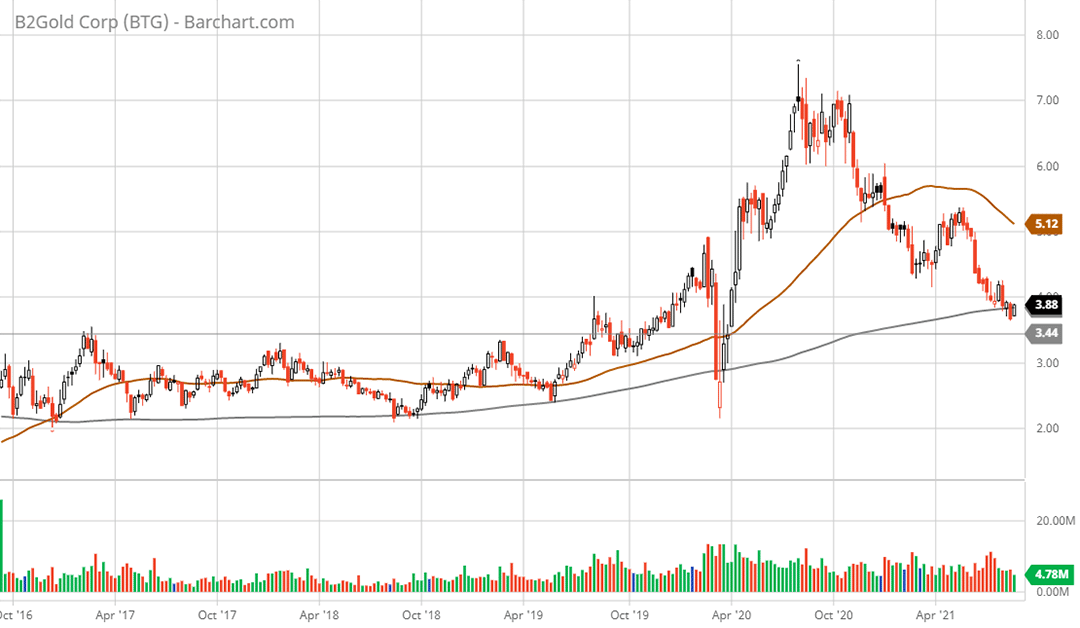
Zooming in to the 5-year weekly chart (below) for B2Gold, these prior tops between 2016 and 2019 become more visible. The weekly tops during this period were in the $3.44 range (see the horizontal line on the weekly chart). This level should offer substantial support given the currently improved gold price environment in comparison to 2016 through 2019. The stock is also sitting on the 200-week moving average (grey line on the weekly chart) which should provide further support for the shares.
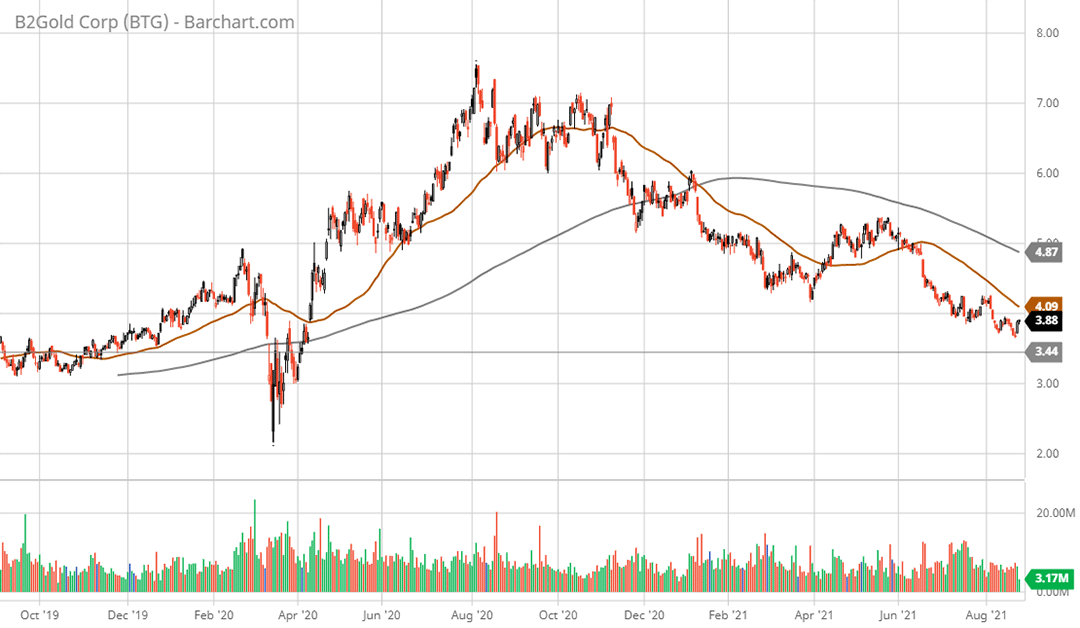
Turning to the 2-year daily chart (below), the yearlong bear market in B2Gold since the August 2020 all-time high is the defining characteristic. It should be noted that the stock is currently sitting just above the worst levels of the March 2020 COVID market-wide crash. The outlook today is much better than at the depths in March of 2020. While the recent trend is down, the rate of decent has slowed considerably and B2Gold is now sitting on top of strong technical support levels across all time frames.
Summary
All told, the valuation of B2Gold is quite attractive in its own right. This is amplified by the long-term bullish technical setup for the price of gold. Bolstering the case further is the technical setup for B2Gold as it approaches strong, long-term technical support levels. For high-risk, high-reward investors, the risk-reward tradeoff tilts heavily toward reward as things stand.
Technical resistance: The first meaningful resistance should be in the $4.40 area which was broken support in March 2021. This should be followed by resistance in the $5 to $5.20 range which was broken support from November 2020. The next resistance prior to all-time highs is $6 which was broken support from the topping process between August and November of 2020.
Technical support: The $3.44 area should offer strong support on all time frames followed by $3.
Price as of this report 8-24-21: $3.88
B2Gold Investor Relations Website: B2Gold Investor Relations
All data in this report is compiled from the B2Gold investor relations website and SEC filings, and where applicable publicly available information regarding consensus earnings estimates.


