I am assigning BorgWarner (NYSE:BWA) a positive risk/reward rating based on a cyclical upturn in global auto production, the secular growth trend toward electrification of transportation, and a positively skewed potential return spectrum resulting from its discounted valuation and robust growth profile.
Risk/Reward Rating: Positive
On November 3, 2021, BorgWarner reported 79% sales growth through the first nine months of 2021 and 35% sales growth for Q3 2021 compared to Q3 2020. The exceptional growth year-to-date was driven by the acquisition of Delphi Technologies (which closed late in 2020) and a rebound in the global automotive industry from the COVID shutdowns.
The following table was compiled from BorgWarner’s Q3 2021 8-K, 2020 10-K, 2017 10-K, 2014 10-K, and 2011 10-K filed with the SEC. The table places the company’s forecasted sales for 2021 in a historical context. The 2021* column reflects the midpoint of the company’s 2021 sales guidance.
Source: Created by Brian Kapp, stoxdox
I have highlighted 2010 and 2021 as they represent years following a recession. The current rebound is unusual compared to prior cycles in that BorgWarner expects its weighted light and commercial vehicle markets to end the year down 2.5% to flat compared to 2020. The 43% expected growth rate for 2021 reflects approximately 10% organic sales growth and 33% growth from acquisitions. With the industry expected to be flat to down 2.5% in 2021, BorgWarner looks to be taking material market share in the global automotive supply chain. Additionally, this means that the 43% growth expected for 2021 is occurring prior to an actual rebound in automotive production. This is a much different setup compared to the 43% sales growth in 2010 which was driven by an industry rebound from the 2007 to 2009 recession.
Industry Positioning
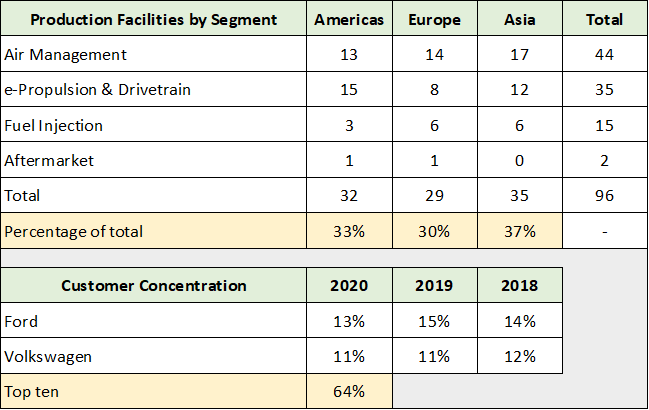
Given the supply chain disruptions caused by COVID, BorgWarner’s global manufacturing capability and diversified customer base should serve it well in winning further market share in the future. The following table, compiled from the company’s 2020 10-K filed with the SEC, provides an overview of BorgWarner’s global positioning.
Source: Created by Brian Kapp, stoxdox
Notice the geographic diversification of the company’s production facilities which are evenly split across the three primary regions of the world. Additionally, the company’s largest customers account for only 13% and 11% of sales with the top ten accounting for only 64% of sales. This is impressive as the global auto industry is dominated by large manufacturers, which lends itself to a reliance by many automotive suppliers on a few customers. BorgWarner counts nearly all major global auto manufacturers as clients.
State of the Auto Industry: Cyclical Growth
As mentioned above, the 43% growth in 2021 is not being driven by a rebound in auto production as is normally the case following a recession. In fact, the state of the automotive industry is in unchartered waters from an inventory and production standpoint. The following charts display auto inventories in the US through November 2021 and were compiled from the St. Louis Federal Reserve FRED database.
Source: St. Louis Federal Reserve FRED database
Notice that inventories in the US are for all intents and purposes depleted as a result of the COVID supply chain disruptions and the resulting constraints on auto production. The semiconductor shortage in particular has caused auto production to be constrained. The following chart shows the inventory to sales ratio in the US.
Source: St. Louis Federal Reserve FRED database
The US auto industry has never reached such a depleted state in modern times and mirrors the state of the global automotive industry. BorgWarner is levered to global vehicle production, with only 12% of sales coming from the Aftermarket segment year-to-date. As can be seen in the above charts, the supply and demand balance has not been more favorable in modern times. With supply constraints expected to persist into 2022, BorgWarner likely faces a powerful cyclical upturn in vehicle production looking to the 2023-to-2025-time frame.
Secular Growth: Electric Vehicles
With global auto production entering a powerful cyclical upturn as shown above, the industry is also entering a secular growth phase for electric vehicles or EVs. The EV opportunity is extraordinary for BorgWarner. The company expects to achieve EV product sales of $350 million in 2021 which amounts to only 2% of total sales. The following table was compiled from BorgWarner’s Investor Day 2021 Presentation on March 23, 2021. It displays the company’s long-term forecast for the EV market and its expected EV sales. Please note that TAM stands for Total Addressable Market and ICE stands for Internal Combustion Engine.
Source: Created by Brian Kapp, stoxdox
I have highlighted the key data points. EV product sales are projected to grow at an incredible 89% per year through 2025 and 45% per year through 2030 (highlighted in blue). These growth rates are extraordinary and are on par with the top tier growth stocks in the market today. Please keep in mind that this growth is just the EV market and not BorgWarner’s total business which is currently 98% non-EV.
The most interesting data points in the table above are highlighted in yellow. BorgWarner anticipates 3x as much revenue potential per vehicle from EVs compared to ICE vehicles. Hybrid vehicles are likewise expected to offer 2x the revenue potential per vehicle. The transition from ICE to EVs and Hybrids is an extraordinary growth opportunity for BorgWarner.
I have highlighted in orange BorgWarner’s estimated market share in its addressable EV markets. An expected combined eLV and eCV 10% market share by 2030 looks to be reasonable and may even prove conservative. There is ample room for upside here as the company is pursuing an aggressive EV strategy. The following quote from BorgWarner’s Q3 2021 10-Q filed with the SEC reaffirms this strategy:
The Company announced at its Investor Day on March 23, 2021, its strategy to aggressively grow its electrification portfolio over time through organic investments and technology-focused acquisitions, most recently through the 2020 purchase of Delphi Technologies as well as the then-pending, and subsequently completed, acquisition of AKASOL.
EV Product Highlights
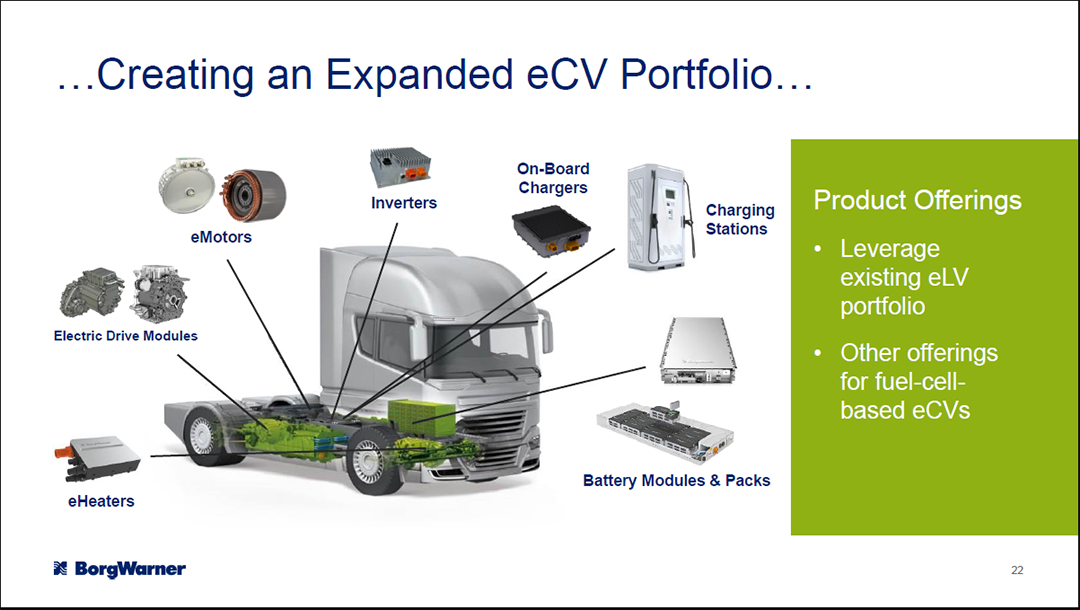
A picture is worth a thousand words, and this is certainly the case for understanding BorgWarner’s EV opportunities. In this section I will lean on imagery to convey the EV opportunity set for BorgWarner. This approach will place the above EV market forecasts into greater context. The following two images provide a sense for the product capabilities that BorgWarner has developed and acquired for the commercial EV market. Please note that the product capabilities are shaded in green. The first image is from the AKASOL website which was recently acquired by BorgWarner. AKASOL manufactures high-performance lithium-ion battery systems for commercial vehicles, buses, industrial vehicles, rail applications, and marine applications.
The next image is from the Investor Day 2021 Presentation and further illuminates the commercial EV opportunity.
Source: BorgWarner’s Investor Day 2021 Presentation
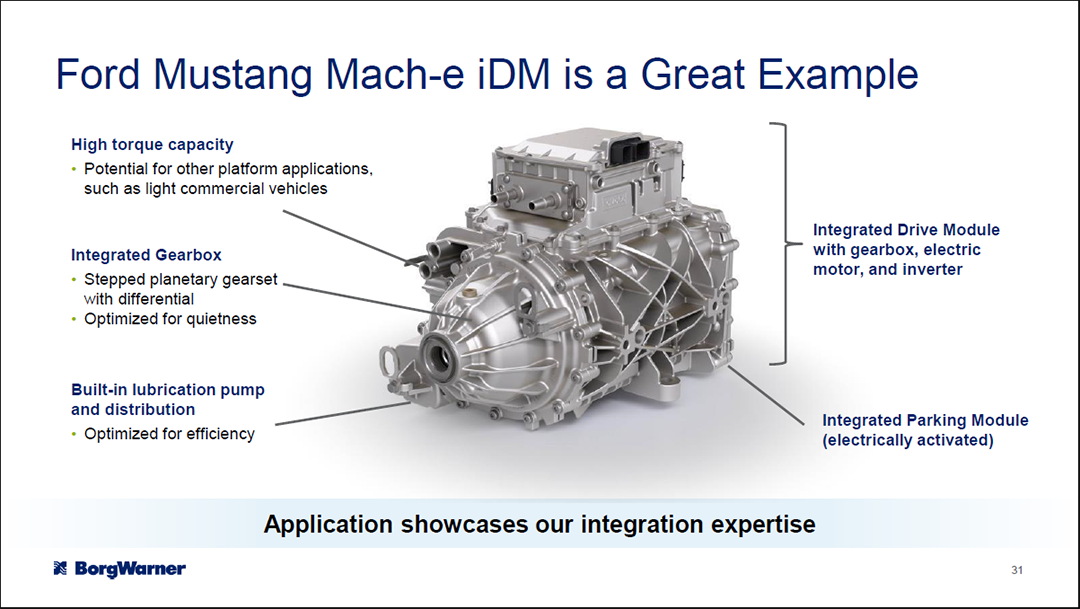
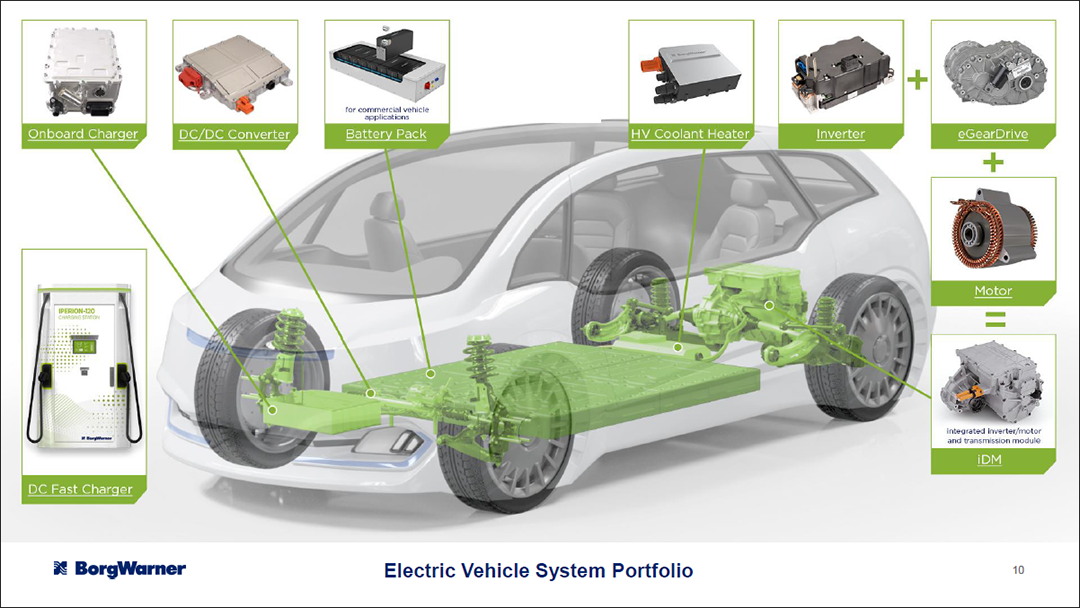
Turning to the light vehicle EV opportunity, the following image is from the 2021 Investor Day Presentation and highlights BorgWarner’s integrated solution capabilities or IDM (Integrated Drive Module). This example highlights BorgWarner’s ability to supply the gear box, electric motor, and inverter as a single, integrated solution to the transportation industry. Ford Motor chose the solution for its premium Mustang brand in the Mustang Mach-E SUV.
Source: BorgWarner’s Investor Day 2021 Presentation
The IDM capabilities offer excellent near-term growth potential in the Asian market which is the largest EV market in the world. This is also a notable example of BorgWarner’s larger revenue opportunity per vehicle for EVs compared to ICE vehicles. The next slide from the Q4 2021 Investor Presentation further illuminates BorgWarner’s opportunity set in the light vehicle market.
Source: BorgWarner’s Q4 2021 Investor Presentation
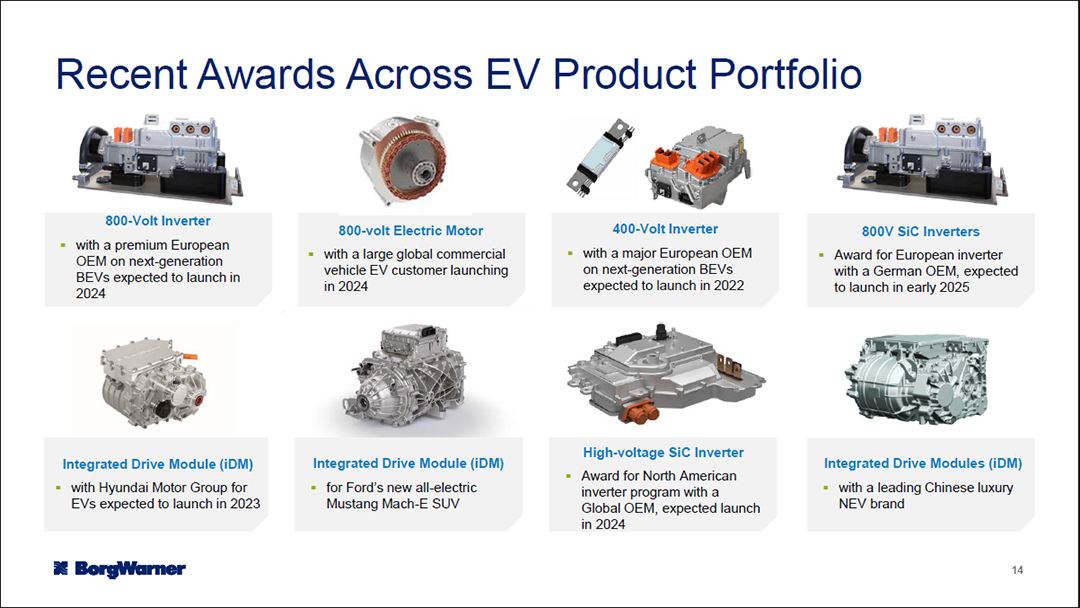
Finally, the following image from the same presentation presents recent wins and highlights BorgWarner’s global reach, customer diversification, and growing EV market penetration.
Source: BorgWarner’s Q4 2021 Investor Presentation
Consensus Growth Estimates
While the EV market is forecasted to grow at an incredible rate over the coming decade, the ICE market is set to stagnate and decline as EVs and Hybrids increasingly displace them. These competing forces create some challenges for forecasting BorgWarner’s growth. Having reviewed the secular and cyclical growth opportunities above, it is time to step back and review consensus growth estimates for BorgWarner and begin to piece together the investment case. The following table was compiled from Seeking Alpha and displays consensus earnings and sales estimates for BorgWarner through 2025.
Source: Seeking Alpha. Created by Brian Kapp, stoxdox
Please note that all data in the above table is from Seeking Alpha except the “8% NI” column. This column represents my estimate of BorgWarner’s earnings per share if it achieves an 8% net income margin on consensus sales estimates. 8% is the median net income margin that BorgWarner has achieved over the past eleven years. As a result, I view it as a reasonable estimate going forward and use it here as a check on consensus earnings estimates. The “8% NI” column provides a sense for whether consensus earnings estimates are conservative or aggressive. Notice that it is above the consensus estimate for each year except 2025, and that it is within the high and low estimates for each year after 2021. This suggests that consensus earnings estimates are reasonable.
I have highlighted the discrepancy between the growth rate (highlighted in blue) and the PE multiple (highlighted in yellow) in the upper section of the table. At minimum, BorgWarner offers excellent growth at a very reasonable price if consensus estimates are in the ballpark.
To place the above PE multiples in a historic context, the following table displays BorgWarner’s historical high PE each year based on its adjusted earnings that year. I have highlighted the low, high, and median PE for the period. Please note that I excluded 2009 due to it being an outlier during an extreme one-off event.
Source: Created by Brian Kapp, stoxdox
The PE ratio range based on consensus earnings estimates through 2025 is 6x to 12x, which is well-below historical norms. The large valuation discount offers further support for the growth at a very reasonable price thesis. Please keep in mind that the 44% sales growth expected in 2021 is against a stagnant to down 2.5% industry backdrop. Also recall that the 43% sales growth posted in 2010 coming out of the last recession was due to a large industry rebound off the 2009 recession bottom. This is important because the consensus sales growth rates for 2022 through 2024 do not reflect a large industry rebound as was seen in 2010 and 2011 at 43% and 26% respectively. These years are the most similar to the 2022 to 2024 period from a cyclical perspective.
In the consensus estimate table, I have highlighted in orange the years that look to be especially conservative from a sales growth perspective. One factor that could be at play, with the moderate sales growth estimates compared to past cycles, is that BorgWarner intends to sell some of its internal combustion engine product lines through 2025. The estimated sales of these planned dispositions are in the $3 to $4 billion range annually. Nonetheless, given the depleted nature of industry inventories discussed above, the cyclical rebound potential may create upside surprises for BorgWarner through 2025.
Consensus growth estimates look to be reasonable with ample opportunity for BorgWarner to outperform expectations. When one considers the depletion of global inventories and the secular EV growth opportunity, the potential for upside surprises is promising.
Potential Return Profile
The excellent growth potential and realistic expectations create the possibility of material upside surprises. This, in addition to the discounted valuation compared to historical valuation norms, provides solid support for running various potential return scenarios. The potential return spectrum is well defined by using consensus earnings estimates through 2025 and applying the range of historic valuation multiples (from the above historical PE data). The following table applies the historic median, low, and high PE multiple to the consensus earnings estimate each year. The upper portion of the table displays the resulting price targets, the middle section displays the total return potential, and the lower portion annualizes the total return. Please note that the share price was $45 at the time of this analysis.
Source: Created by Brian Kapp, stoxdox
I have highlighted in blue what I view as a reasonable baseline expectation. This is the median historical PE applied to each year’s consensus earnings estimate. The yellow highlighted cells represent the low end of the expected return profile if consensus estimates are achieved. With a total return range of -7% to +219%, the risk/reward potential is highly skewed to the upside.
Please note that this return spectrum assumes consensus estimates are achieved. Given the cyclical low in global vehicle production and the explosive growth in EVs, I view a major automotive recession between 2022 and 2025 as being a low probability. This lends support to my belief that consensus estimates are achievable and could be surpassed.
Technicals
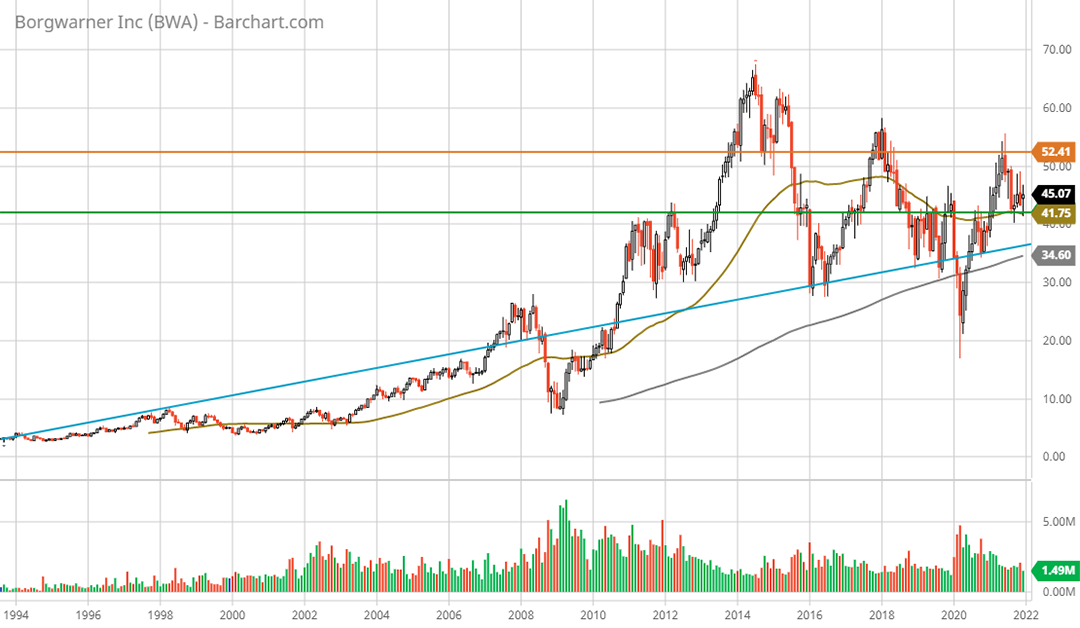
The technical backdrop for BorgWarner is also supportive of the above projections. This is especially the case for the limited downside potential estimated based on fundamentals and valuation. The following monthly chart provides a bird’s-eye view of the technical setup. I have highlighted key support and resistance levels with the three colored lines. The orange line represents the primary resistance area, while the green and blue lines represent primary support levels.
BorgWarner max monthly chart. Created by Brian Kapp using a chart from Barchart.com
The blue line is the long-term uptrend that has best defined BorgWarner’s share price trajectory. This trend is currently near $36 per share and represents 20% downside potential. Since 2011, BorgWarner has been confined to a sideways consolidation pattern. The central tendency since 2011 is highlighted by the green line which is near $42 and represents 7% downside risk. This is identical to the downside projection from the fundamental return profile constructed above. Each of these levels should provide very strong fundamental and technical support.
The following 5-year weekly chart provides a closer look at the key levels.
BorgWarner 5-year weekly chart. Created by Brian Kapp using a chart from Barchart.com
The orange line near $53 represents the beginning of all-time high resistance and is 18% higher than current levels. The all-time high near $68 was reached in July 2014 and represents 51% upside. Given the lack of trading near and above the orange line and its proximity to all-time highs, technical resistance should be moderate. Additionally, the 51% return potential to all-time highs is near the fundamental upside return estimate reached by applying the median PE to the consensus earnings estimate for 2021 (63% return potential). There are no technical resistance levels once all-time highs are surpassed.
What is most notable about the technical backdrop is the convergence of the primary support and resistance levels. This convergence looks to be creating a coiled spring dynamic given the tight range bounded by the orange and blue lines. Given the general upward sloping triangle pattern, the technical picture supports an eventual upside breakout from the range in place since 2011. Technically speaking, the coiled nature of the trading pattern suggests a breakout could be powerful when it occurs.
Summary
The strong technical support reinforces the positively skewed risk/reward profile that was discussed in the potential return section. BorgWarner is a top-tier supplier serving the world’s leading automotive manufacturers. The cyclical upturn in transportation production looks to be the most powerful in some time, while the EV super cycle has reached the inflection point of its S curve. At 10x 2022 earnings estimates, BorgWarner is a top choice for cyclical and secular growth.
Price as of report date 1-3-22: $45
BorgWarner Investor Relations Website: BorgWarner Investor Relations

