I first covered BorgWarner (NYSE:BWA) on January 5, 2022 in “BorgWarner is a top choice for EV growth.” In summarizing BorgWarner last January, I made the following observation:
BorgWarner is a top-tier supplier serving the world’s leading automotive manufacturers. The cyclical upturn in transportation production looks to be the most powerful in some time, while the EV super cycle has reached the inflection point of its S curve.
Risk/Reward Rating: Positive
While BorgWarner remains the leading supplier to the world’s top automotive manufacturers, the cyclical upturn referenced above has been stunted by the rapid increase in interest rates. Autos are interest rate sensitive as they are financed by the vast majority of consumers. The following chart, courtesy of the St. Louis Federal Reserve, displays the cyclical deceleration in total US vehicle sales since Q3 2021.
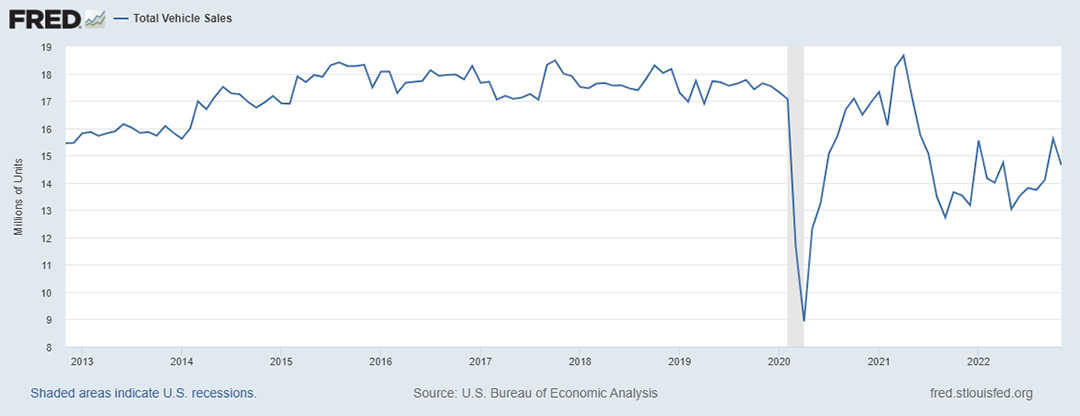
The following chart zooms in and places the current cyclical contraction in the context of the past 10 years.
From a historical perspective, the equilibrium rate in the US vehicle market is 17 to 18 million units sold per year. Since Q3 2021, the annual sales pace has fluctuated between 12.5 and 15.5 million units with a central tendency near 14 million. This is 20% below the equilibrium rate during recent economic expansions.
The current US sales rate is consistent with the US auto market being in a recession for the past 16 months. Importantly, BorgWarner is a globally diversified supplier. From the January 2022 report:
Notice the geographic diversification of the company’s production facilities which are evenly split across the three primary regions of the world. Additionally, the company’s largest customers account for only 13% and 11% of sales with the top ten accounting for only 64% of sales… BorgWarner counts nearly all major global auto manufacturers as clients.
The current vehicle recession in the US is mirrored globally. The following chart of global vehicle sales through Q3 2022 is from David Leggett‘s article “Global vehicle market sales rate falls back” on JustAuto. The chart suggests that the current cycle is within a larger 5-year downtrend in vehicle unit sales globally.
Global vehicle sales estimates are for just over 79 million units in 2022 and 79 to 81 million in 2023. If accurate, 2023 will be the fifth year of unit sales contraction in the global vehicle market.
Fundamentals
The current cyclical downturn is reflected in consensus earnings estimates since the last BorgWarner report. Estimates have been reduced by low to mid-teen percentage amounts for 2023, 2024, and 2025. The following table compares consensus estimates as of today to those as of January 5, 2022 with the percentage change in the lower section.
Analysts have reduced estimates uniformly through mid-decade. Given the length of the existing US and global vehicle contraction, the reductions for 2024 and 2025 are likely to be too conservative. This opens the door to meaningful upside surprise potential.
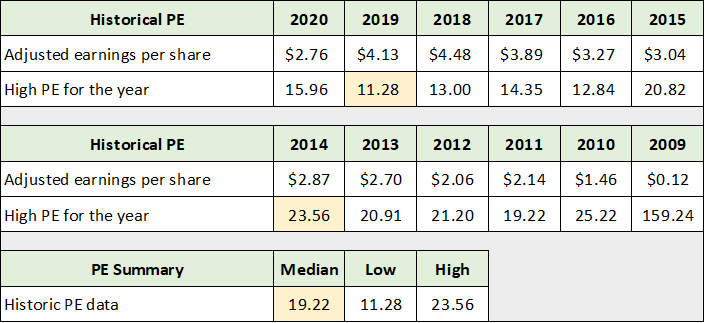
Notice that BorgWarner’s valuation multiple has expanded against the backdrop of lowered earnings estimates (highlighted in yellow). The valuation expansion is consistent with consensus estimates being too low into mid-decade. That said, BorgWarner has a history of trading at a materially higher valuation than the current mid to high single-digit PE ratio into 2025. From the January 2022 report:
During the last US cyclical expansion from 2009 through 2015, BorgWarner regularly traded at or above 20x earnings. While the cyclical expansion lasted into 2018 globally, BorgWarner’s valuation began to contract to the mid-teens following the cyclical US peak in 2015.
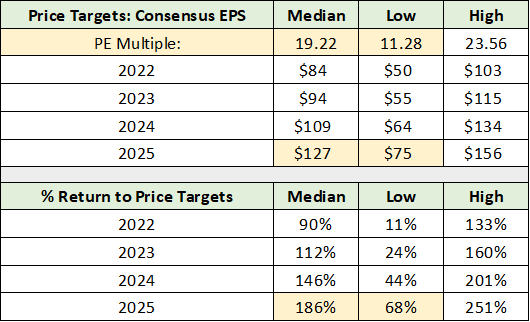
Nonetheless, the multiple expansion opportunity today is significant and well supported from a historical perspective. Using the current reduced earnings estimates through 2025, and applying the historical PE range used in the January 2022 report, the upside potential is displayed in the following table.
I have highlighted in yellow what I view to be reasonable and well supported upside scenarios for BorgWarner’s potential return spectrum into 2025. The annualized rates of return to the upper and lower end of the range are 42% and 19%, respectively.
Technicals
To complete the potential return spectrum, the downside potential is best framed by the technical backdrop, as the valuation is already below historical norms on reduced earnings estimates. Technically speaking, BorgWarner is behaving as expected. The following 5-year weekly chart from the January 2022 report sets the stage.

BorgWarner 5-year weekly chart (January 2022). Created by Brian Kapp using a chart from Barchart.com
In the above chart, the blue and green lines represent key support levels as of January 2022 at $35 to $40, respectively. In the updated chart below, I replaced the blue upward sloping support level with a green horizontal support line.
Notice that BorgWarner has formed a 5-year inverse head and shoulders pattern with the lower blue (above) and green lines (below) serving as the neckline. Technically speaking, the formation carries a bullish interpretation as it is a recurring bottoming pattern.
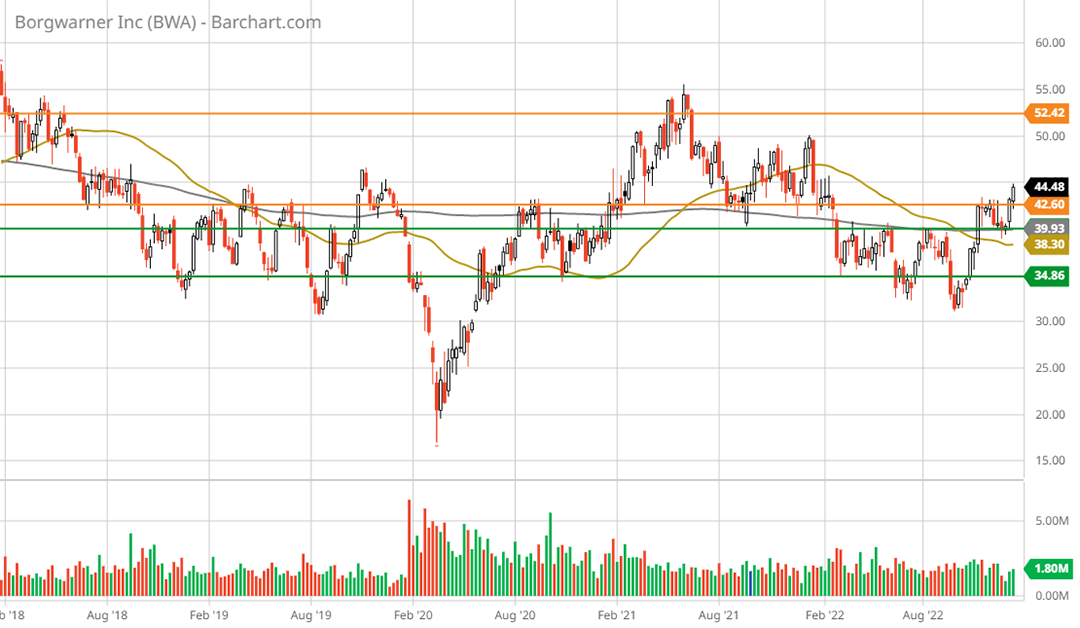
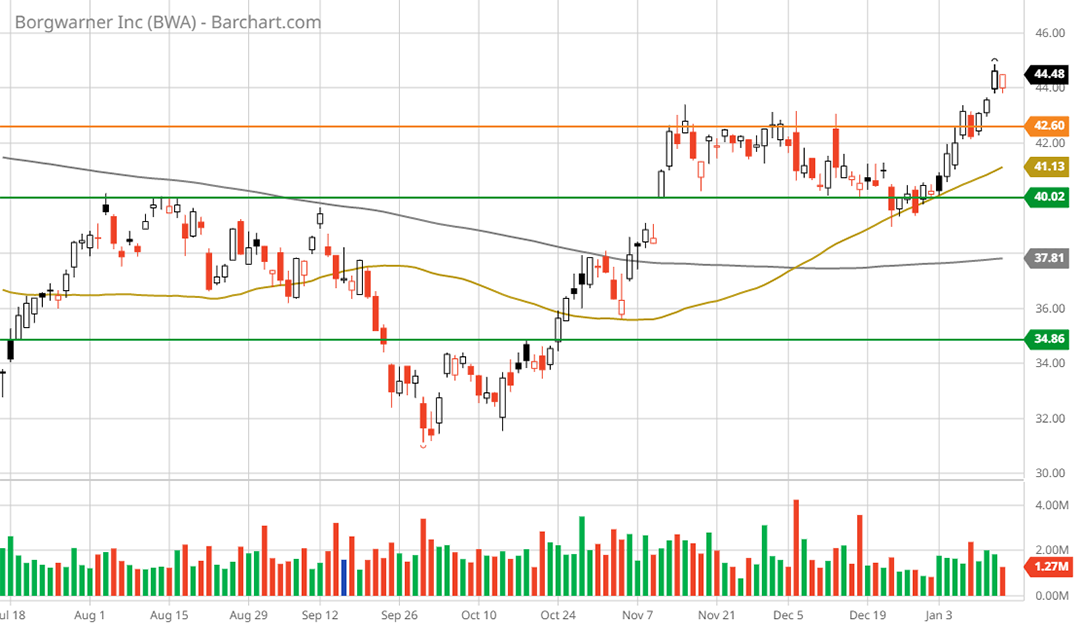
Please note that the orange lines represent the primary resistance levels, with BorgWarner surpassing the first resistance level last week. Zooming in, the following 6-month daily chart captures the recent test of lower support and the bullish price action since.
BorgWarner’s share price successfully tested lower support at just under $35 between September and October 2022. The shares are now clearly in a short-term uptrend. Note that the gold line is the 50-period moving average and the grey line is the 200-period moving average. Confirming the new uptrend, the 50-day crossed above the 200-day moving average on December 6, 2022. This is called a golden cross and carries a bullish interpretation.
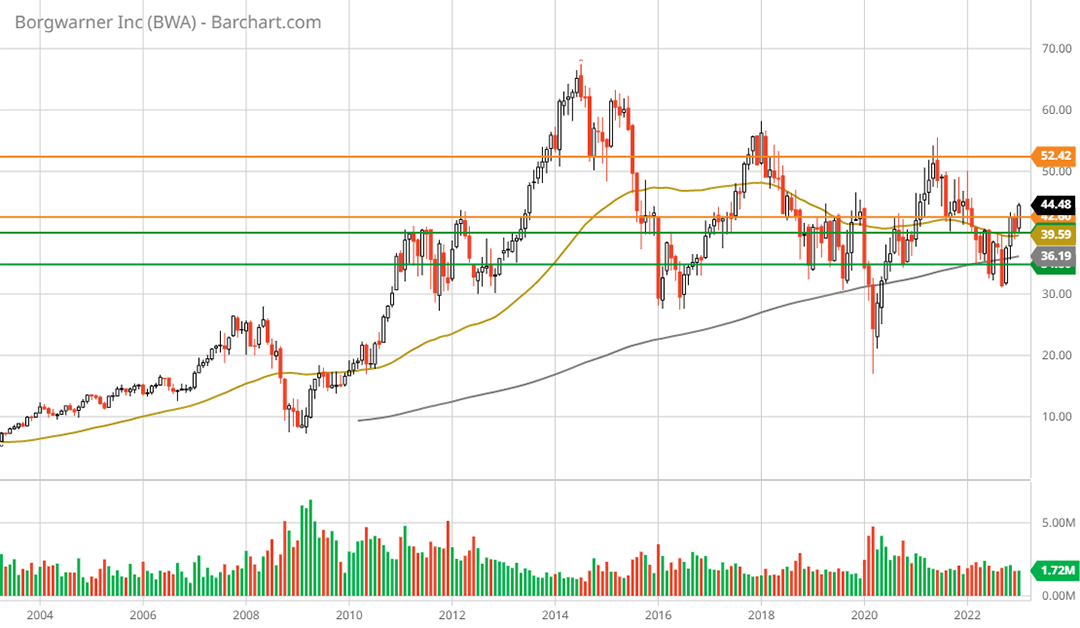
Zooming out, BorgWarner has been in a sideways consolidation since 2011. The length of the consolidation speaks to the incredibly strong technical support in the zone between the two green lines. The following 20-year monthly chart offers a bird’s eye view.
While noting that the lower blue line was replaced with a green line, the following quote from the January 2022 report continues to capture the big picture, technically speaking.
What is most notable about the technical backdrop is the convergence of the primary support and resistance levels. This convergence looks to be creating a coiled spring dynamic given the tight range bounded by the orange and blue lines… the technical picture supports an eventual upside breakout from the range in place since 2011.
Importantly, there is no visible resistance above the upper resistance level near $53. With the shares trading at $44.48, an upside breakout is within 20% to the upside. The technicals align with the fundamentals, the downside has strong support nearby while the upside is material and unbounded.
Electrification of Transportation: EVs
The extent of BorgWarner’s upside potential will be determined by its success in transitioning to EVs and the electrification of transportation broadly. As the secular trend toward electrification is now reaching an inflection point on the growth S curve, BorgWarner is participating in one of the largest growth opportunities into the 2030s and beyond.
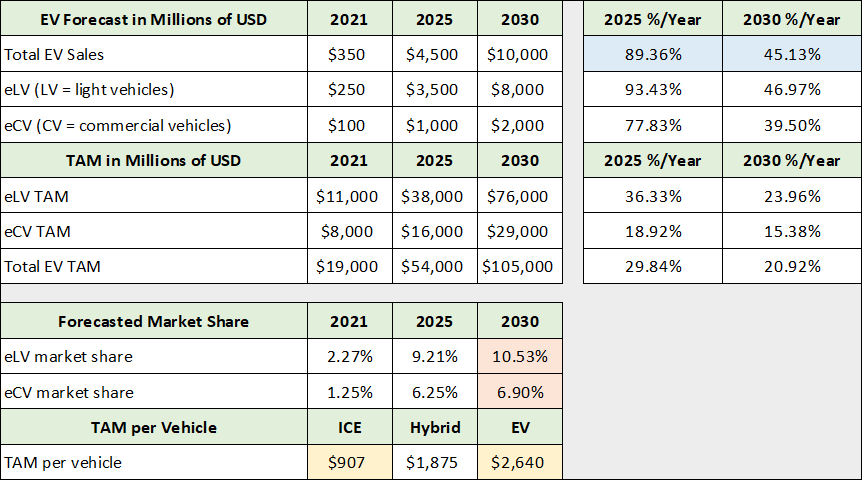
BorgWarner is progressing along the electrification growth roadmap as outlined in the January 2022 report. The following table from the prior report summarizes the expected size of the electrification opportunity.
I have highlighted in blue the forecasted annualized sales growth rate through 2025 and 2030. The growth potential is extraordinary by any measure. BorgWarner provided an update on its progress towards these goals in its Q3 2022 earnings release. From the earnings report:
Based on new business awards and actions announced to date, BorgWarner believes it is already on track to achieve approximately $4 billion of electric vehicle revenue by 2025.
With $4 billion of EV revenue in line of sight for 2025, BorgWarner has already achieved 90% of its target. The market share projected by 2030 is 10% or less, which offers room for significant growth compared to expectations. A recent investment and supply agreement with Wolfspeed (NYSE:WOLF) speaks to BorgWarner’s growth opportunities.
Spinoff
EV success is also being driven by BorgWarner’s active portfolio approach. The company is executing an aggressive growth acquisition strategy today. This bodes well for future growth potential.
BorgWarner is actively managing its mature product lines as well. This is evidenced by its plan to create a new company, a spin-off of their Fuel Systems and Aftermarket segments. It represents roughly 20% of 2022 sales. If completed, shareholders will receive the shares of the new company via a tax-free spinoff, which will then trade separately.
The legacy business will likely be a large cash flow generator well into the future, though within a long-term decline curve. Having the spinoff assets valued separately from BorgWarner’s growth portfolio will amplify the multiple expansion potential.
Summary
The annual growth rates highlighted in blue in the above table could easily drive a return to the historical PE multiples used in the potential return spectrum herein. A spinoff of the legacy business is a positive development in this respect. Multiple expansion is at the core of the bullish case for BorgWarner.
While risks are elevated given the fundamental transformation underway in the industry, so too are the opportunities. The risk/reward asymmetry remains decidedly skewed to the upside for BorgWarner.
Price as of this report: $44.48


