
I am assigning Amazon (NASDAQ: AMZN) a negative risk/reward rating based on a heightened risk of underperforming consensus estimates in the coming quarters, an elevated valuation, and the possibility of a historically low return growth investment cycle. That being said, for blue-chip growth-oriented investors, Amazon would make for an attractive investment opportunity at the right price.
In this article I breakdown Amazon’s recent business performance and place it in a historical perspective to draw conclusions about the likely pathway forward. I then compare these estimates to current market expectations to quantify risk before turning to the valuation and the technical backdrop to formulate a strategy for the shares.
Risk/Reward Rating: Negative
Amazon was the largest beneficiary of the COVID lockdowns by absolute revenue growth. COVID was the perfect storm to take market share as the world’s population was under lock down and abiding by social distancing requirements for the better part of a year. Amazon’s revenue growth in 2020 was 38% or nearly double the 20% growth posted in 2019. Sales growth crested at 44% in Q1 2021 which is an incredible rate of change for a company the size of Amazon.
The trend of outsized growth may be about to change as evidenced by the company’s most recent earnings report. Amazon reported an impressive 23% earnings beat for Q2 2021 on July 29, 2021. The shares responded by falling 8% the following day and are now down 10% from the level preceding the report. Investors reacted negatively to the company’s weak guidance for Q3 2021 which came in well below expectations. The primary concern for Amazon’s stock is that the 20% decelerating sales growth pre-COVID may be more indicative of the company’s sustainable business prospects.
The door is now open to a period of disappointing revenue growth. This is occurring against the backdrop of rapidly increasing expenses and investment in additional capacity in response to the COVID demand boost. I will begin my review of Amazon by placing the disappointing Q3 2021 guidance in historical context.
Q3 2021 Guidance
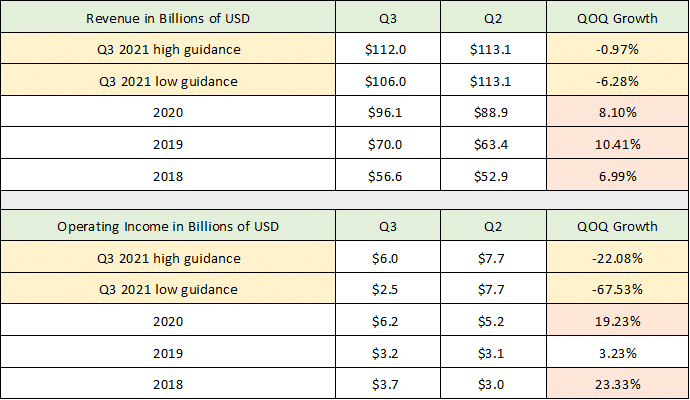
As part of the Q2 2021 earnings report, Amazon provided Q3 2021 guidance for revenue and operating income. The company was unable to provide guidance for Q4 due to uncertainty emanating from the demand distortions caused by COVID. The following tables were compiled from Amazon’s Q2 2021 earnings release, Q2 2021 10-Q, Q3 2019 10-Q, and Q2 2019 10-Q filed with the SEC. I have highlighted Amazon’s high and low guidance for Q3 2021 in yellow (QOQ = quarter-over-quarter).
Source: Created by Brian Kapp, stoxdox
The COVID demand spike in 2020 is widely expected to lead to difficult year-over-year growth comparisons. However, one would expect Amazon’s sequential quarter-over-quarter growth comparisons to generally follow historical patterns. Based on the company’s guidance, the Q3 historical pattern of sequential growth compared to Q2 looks to be at risk. In the final column in the tables above, the pertinent historical Q3 growth rate is highlighted in orange and the current Q3 guidance is highlighted in yellow.
The company is projecting a sequential revenue decline of 1% to 6% in Q3 2021 compared to the historic norm of 7% to 10% growth. This is a substantial trend change given Amazon’s size and market position. On the operating income front, Amazon is projecting a massive sequential decline of 22% to 68%. This compares to the historic growth trend which normally features sizeable growth in the range of 19% to 23%. The 3% growth posted in Q3 2020 was an anomaly as the company had to spend heavily to meet the COVID demand surge.
It should be noted that revenue is the most stable performance measure for Amazon historically. This is because the company cycles through heavy growth investment phases thereby depressing operating income. Even so, the projected declines in Q3 2021 are well outside of historic norms. At minimum this suggests that the COVID demand surge that crested in Q1 2021 is now reversing. The size of the deviation from historical QOQ growth trends for Q3 points toward the possibility that the reversion to normal after COVID could extract a heavy toll on Amazon’s growth rate through Q1 2022 and into Q2 2022.
Annual Growth Trends
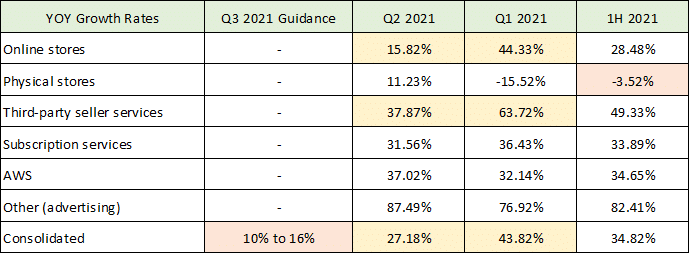
To provide more color on the annual growth trend, the following table outlines Amazon’s YOY (year-over-year) performance through the first half of 2021 and the company’s Q3 2021 guidance for annual revenue growth. The table was compiled from the company’s Q2 2021 earnings release and Q2 2021 10-Q filed with the SEC (1H = first half).
Source: Created by Brian Kapp, stoxdox
I have broken out Amazon’s sales performance across its major product categories to provide a more granular view of the company’s growth drivers. I have highlighted the primary growth risks in yellow while orange highlights areas of immediate concern. The YOY growth peak shown in the Q1 2021 column is striking. Amazon’s two largest business lines, online stores and third-party sellers services, are displaying incredible growth volatility. These two categories contribute 70% of Amazon’s total sales. Online store growth in Q2 2021 was only one-third the growth rate registered in Q1 2021. Third-party seller sales grew at almost half the rate in Q2 2021 compared to Q1 2021. The stronger showing in third-party sellers is largely due to product sale restrictions during the onset of COVID. Amazon restricted these sales to meet government mandates and emergency demand for consumer staples products.
The outsized sales growth impact from the two largest business lines is evident in the final row showing total company sales growth. Guidance for Q3 2021 is for YOY growth at one-quarter to one-third of that achieved at the peak in Q1 2021. Amazon’s other three business lines are performing in a much more stable fashion with growth rates generally similar in Q1 and Q2 of 2021. This is good news as these business lines are Amazon’s most important earnings growth drivers.
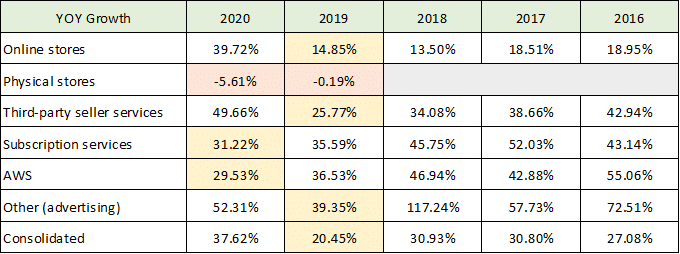
The primary question facing investors is what is Amazon’s sustainable growth rate looking forward? To shed light on this, I look at the growth rate of each revenue category over the preceding five years to uncover the larger trends leading up to the onset of COVID. The following table was compiled from Amazon’s 2020 10-K and 2017 10-K filed with the SEC.
Source: Created by Brian Kapp, stoxdox
I have highlighted what I believe to be the best annual growth trajectories for each revenue category excluding the COVID distortions. The two largest business lines ratcheted well above the underlying growth trend lines during COVID in 2020. Furthermore, these two lines of business were in well-established slowdown trajectories over the prior four years. This suggests that the reassertion of these organic growth trajectories could greatly impact overall sales growth in the coming year.
It is notable that the physical stores category is in a well-defined contraction trend prior to and throughout COVID (orange highlighted cells). This trend continued through the first half of 2021 as noted in the previous table. While this is a small business line (Whole Foods) for Amazon today it is quite informative for the future of this category. I say this because Amazon is experimenting with several physical store concepts for future growth investments. This is important because the organic growth rate of physical store sales is likely to pale in comparison to Amazon’s historic growth rates. This expansion vector would likely weigh heavily on Amazon’s overall profitability and valuation multiple.
Subscription services and AWS are also in well-defined slowdown trajectories. Although the descent is less pronounced suggesting that they will continue to do the majority of the lifting for Amazon’s growth and profitability. The other category, which is primarily advertising, is also a standout during COVID and actually accelerated further to 87% in Q2 2021. This bears watching as the profit margins on advertising are likely large in comparison to the majority of Amazon’s revenue. I expect the growth here to revert back towards the 2019 growth rate as the digital advertising boom of the past year normalizes.
With these underlying trends and management’s guidance for Q3 2021, we can make some estimates for Q4 2021 within a historical context. This is to gauge the level of risk embedded in Amazon’s share price based on current consensus expectations.
Q4 Estimates
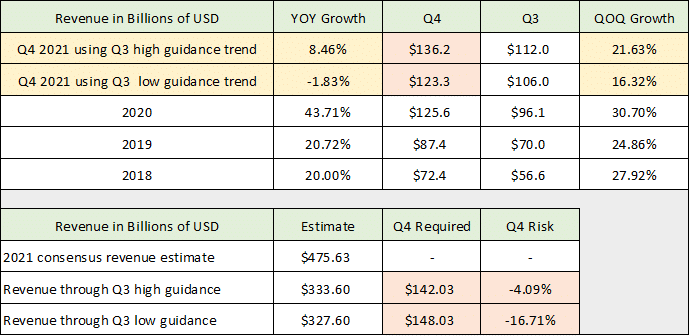
The following table was compiled from Amazon’s Q2 2021 earnings release, Q4 2020 earnings release, Q4 2019 earnings release, and Q4 2018 earnings release. I have extrapolated management’s Q3 2021 guidance and carried the same sequential growth trend through Q4 2021 to provide a high and low estimate for Q4 2021 revenue. I then compare this to the consensus revenue estimate for 2021.
Source: Created by Brian Kapp, stoxdox
The yellow highlighted rows are my extrapolated high and low estimate for Q4 revenue assuming Q4 follows the sequential trend embedded in management’s Q3 2021 guidance (QOQ Growth column). To clarify, the first table in this article provides management’s Q3 guidance. The guidance reflects sequential growth rates that are between 9.07% and 14.38% below the normal seasonal pattern (absolute growth rates). I carry this lower-than-normal sequential growth into Q4 which results in the Q4 high and low sequential growth estimates. This can be seen in the yellow highlighted cells in the QOQ Growth column in the above table (30.7% in Q4 2020 reduced by 9.07% and 14.38%).
If the Q3 guidance trend carries through to Q4, Amazon will post year-over-year revenue growth in Q4 2021 between -1.83% and 8.46%. This estimate is in line with the YOY slowdown trend seen in the first three quarters of 2021, from 44% in Q1 to 27% in Q2, to an estimated 10% to 16% in Q3. Bear in mind that Q4 2020 showed 44% YOY growth or more than double the annual revenue growth rate in 2019 of 20%.
In the lower section of the above table, I compare my extrapolated Q4 revenue estimate range with current consensus revenue estimates for the full year and by extension Q4 2021. Based on Q3 guidance and my resulting high and low revenue estimate range for Q4, Amazon looks to be on trend to miss consensus revenue estimates for Q4 by 4% to 17%. For context, the revenue miss in the Q2 2021 earnings report was 2% off consensus and the stock is down 10% since.
Segment Sales and Profitability
In addition to the business lines outlined above, Amazon reports revenue in three primary segments: North America, International, and AWS. The segment reporting has the added granularity of providing operating income which will provide a bridge to Amazon’s profitability. The following table was compiled from Amazon’s Q2 2021 10-Q filed with the SEC.
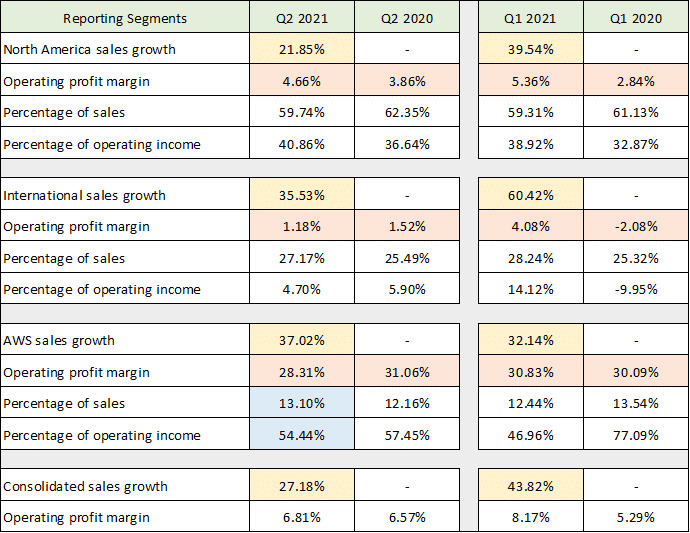
Source: Created by Brian Kapp, stoxdox
I have highlighted the YOY sales growth rates by segment for reference to the above business line sales growth rates. Excluding AWS, each of the other business lines is reported within either North America or International (Amazon does not break out operating profit by business line outside AWS). The operating profit margin for each segment is highlighted in orange. Each reporting segment shows operating income margins declining from Q1 to Q2 2021.
The largest reporting segment is North America which comprises 60% of sales. The operating margin contracted materially from Q1 to Q2 2021 but remains elevated compared to the same quarters in 2020. International comprises 27% of sales with margins contracting rapidly from Q1 to Q2 2021, with Q2 2021 also registering a decline compared to Q2 2020. Finally, AWS margins are materially contracting as well and are down nearly 3% from Q1 2021 and Q2 2020. I have also highlighted AWS’s contribution to total sales and total operating income. This segment is the cornerstone of Amazon’s profitability at 54% of total operating income on only 13% of total sales. As a result, the operating income margin in the AWS segment is a key performance indicator to monitor in future reports.
With margins reversing lower in Q2 2021 and management’s guidance for operating income to contract YOY in Q3 2021 between 22% to 68%, the sustainable operating margins for each segment take center stage.
Operating Profit Margins
Like the revenue sections, it is important to place the recent operating margin volatility in a historic context to uncover the base trendline. The following table was compiled from Amazon’s 2020 10-K and 2017 10-K filed with the SEC. It provides the same segment data as the above table but for the full years of 2015 through 2020.
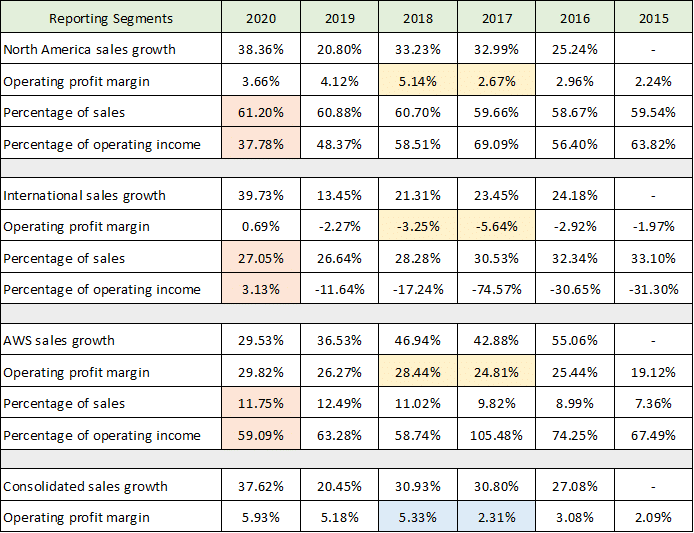
Source: Created by Brian Kapp, stoxdox
Amazon is guiding the consolidated Q3 2021 operating profit margin to be between 2.36% and 5.36%. This is similar to the operating profit margin achieved in 2017 and 2018 (the last row highlighted in blue). For reference, I have highlighted each segment’s operating profit margin in 2017 and 2018 in yellow. Given the lack of granular margin guidance it is difficult to estimate each segment. However, management did provide some color on the Q2 2021 conference call.
The AWS segment contributed 59% of total operating income in 2020 with an operating profit margin of 30%. In Q2 2021, the margin came down to 28%. On the Q2 conference call management mentioned some pricing pressure in the AWS segment. Given the intensifying competition for cloud computing business (Microsoft (NSDQ: MSFT), Google (NSDQ: GOOG), and Oracle (NYSE: ORCL) to name a few), Amazon may compete more aggressively on pricing in the AWS segment. It appears increasingly likely that there may be negative surprises on the margin front here. Given that this segment provides 59% of total operating income, negative margin surprises for AWS could have an outsized impact on Amazon’s share price.
In addition to AWS pricing pressure, Amazon is facing margin pressure across its entire business. The most pressing risk is wage inflation and employee-related expenses. To meet the extraordinary demand during COVID, the company hired 500,000 new employees in 2020. This trend continued in the first half of 2021. Tight labor markets, increasing supply chain expenses, and the threat of revitalized organized labor activity are likely to crimp already tight profit margins in Amazon’s larger business segments.
Profitability and Cash Flow
The diminishing forward-looking profitability trends have already begun to show in Amazon’s cash flow statement. The following table was compiled from Amazon’s Q2 2021 10-Q and Q2 2019 10-Q filed with the SEC. The table displays the company’s trailing 12-month (or TTM) cash flow through the second quarter of each year.
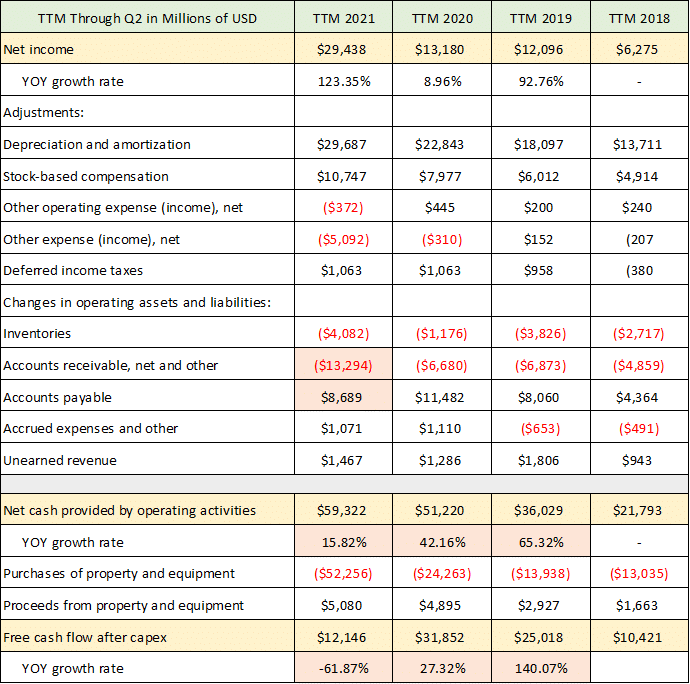
Source: Created by Brian Kapp, stoxdox
I have highlighted the three primary measures of profitability for Amazon: net income, cash flow, and free cash flow. While Amazon reported record net income up 123% over the trailing 12 months, cash flow growth has slowed materially to 16%. In addition, free cash flow has already turned negative and is now down 62% (orange highlighted cells in the lower section). Based on management’s guidance for Q3 2021, net income looks set to follow the two cash flow growth rates lower.
It should be noted that Amazon has a history of erratic profitability due to periodic growth investment ramps. This pattern tends to reduce the concern amongst investors when profitability turns lower as they expect the investments to produce outsized gains in future years. While this could certainly be the case again, some caution is in order this time.
I say this because the investment levels the past two years are incredible and dwarf the historical investment scale. Please note the trend in purchases of property and equipment in the table above. These investments have roughly doubled in each of the past two years, from $14 billion in the 2019 TTM to $24 billion in 2020, and $52 billion in 2021. Many of these investments are in physical supply chain buildout (more similar to FedEx and UPS) rather than in technology infrastructure buildout (think higher margin AWS).
As a result, many of the current growth investments offer lower returns and require higher maintenance capital than the traditional, more heavily technology-focused investment cycle. The historic rapid return on investment following an Amazon growth cycle that the market has come to expect may not materialize. This creates a heightened risk of disappointing growth looking forward.
Consensus Estimates and Valuation
The current consensus growth estimates take on added importance due to the heightened risk of disappointment exiting 2021 and the likelihood that recent investments will be less rewarding to shareholders than in previous cycles. The following table was compiled from Seeking Alpha and displays consensus estimates for earnings and revenue through 2023.
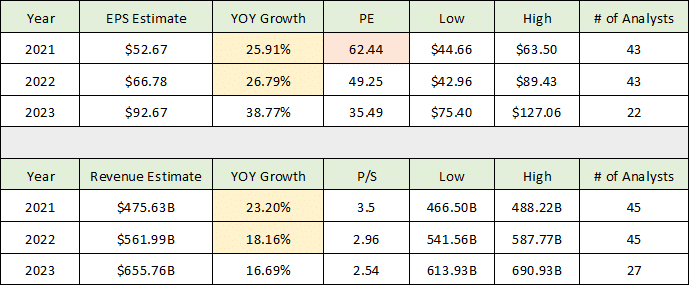
Source: Seeking Alpha. Created by Brian Kapp, stoxdox
I have highlighted the areas of greatest concern for disappointment and the most acute period of risk for Amazon shareholders. On the earnings front, the final quarters of 2021 appear to be at risk as does the 27% earnings growth expected in 2022. Recall that Q3 2021 is setting up to be the first year-over-year earnings contraction of this cycle and follows record high net income in Q2 2021. It is highly unlikely that the unfolding profit decline trend will reverse higher entering 2022 as Amazon is facing record profit comparisons through Q2 2022. As a result, there is a high probability of a material earnings miss exiting 2021 and into 2022 rendering the forward PE multiples moot.
Turning to revenue, we discussed the substantial risk of missing the full year 2021 revenue estimate earlier. If the Q3 2021 guidance trend holds and carries over into Q4 2021 and 2022, there is substantial risk to both the 2021 and 2022 sales estimate as well. In fact, it is possible for Amazon to exit 2021 with a single digit sales growth rate facing record sales comparisons in the first half of 2022.
Consensus growth estimates for earnings and revenue appear to be at substantial risk near term. Thus, the current share price carries an elevated risk of lower growth estimates and corresponding valuation.
Valuation
Amazon is trading at 62x the 2021 consensus earnings estimate and 3.5x sales (see above table). The following table provides the valuation multiple based on the recent peak trailing 12-month figures and is compiled from the Q2 2021 10-Q and Q2 2019 10-Q. I have highlighted net income and free cash flow as they are the most appropriate measures of Amazon’s earnings power.

Source: Created by Brian Kapp, stoxdox
On peak numbers, Amazon is trading at 52x free cash flow and 57x net income. These figures are elevated for a mega-cap company. This is the case compared to historic market norms and relative to current market averages which range from 21x to 33x forward 12-month earnings estimates (S&P 500: 21x, Nasdaq 100: 28x, and Russell 2000: 33x).
For more valuation perspective, I find it informative to compare Amazon’s valuation to that of other similar companies. In the following table I have chosen a comparable company for each of Amazon’s business lines. The companies are Wal Mart (NYSE: WMT), Kroger (NYSE: KR), UPS (NYSE: UPS), Netflix (NASDAQ: NFLX), Microsoft and Google. I then use the current price-to-sales valuation multiple of each comparable company and apply it to each of Amazon’s major business lines to arrive at a valuation estimate for Amazon.
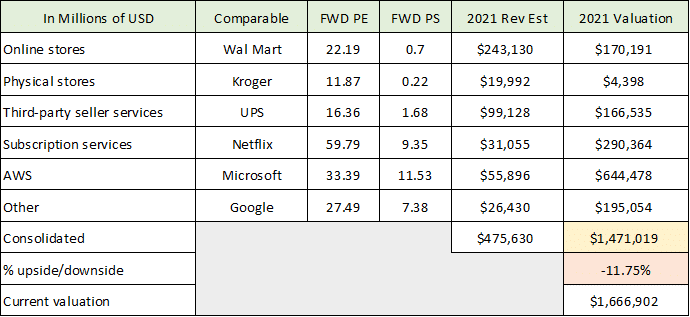
Source: Created by Brian Kapp, stoxdox
I believe the comparable companies for each of Amazon’s business lines offer important valuation information, although they are not perfect. Based on this approach, Amazon offers 12% downside from current levels on a relative basis. Keep in mind that this valuation approach is relative so the downside risk would be greater in a general market-wide valuation correction.
On each measure, Amazon is trading at an elevated valuation level. The elevated valuation risk is compounded by the heightened risk of a material miss to near-term growth estimates as discussed above. The technical backdrop should be informative in outlining an investment strategy for the shares.
Technicals
Amazon has been confined to a sideways trading range since July 2020 as can be seen on the following 5-year weekly chart. The trading range is well defined by a mildly upsloping support level near the current price in the $3,200 area (green line) and overhead resistance in the $3,500 area (the horizontal orange line).
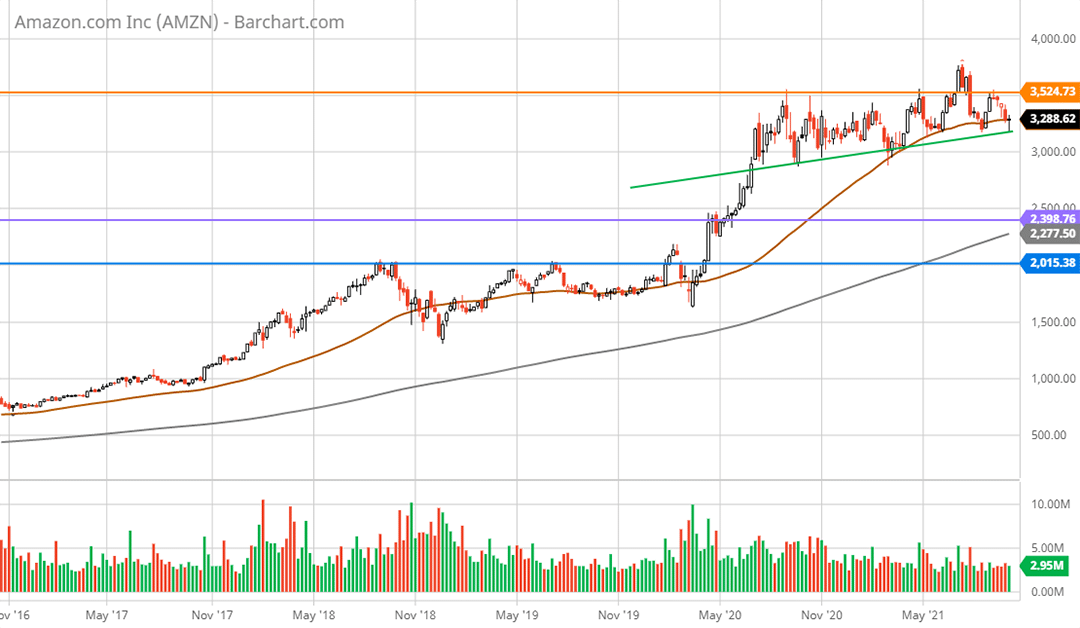
Amazon 5-year weekly chart. Created by Brian Kapp using a chart from Barchart.com
The repeated testing of support along the green trend line suggests that this level may fail to hold. When the fundamental discussion above is added to the picture, the lower support levels take on added importance. There are two well-defined lower support levels near $2,400 (the purple line) then $2,000 (the blue line). I carry the above lines over to the 2-year daily chart below for a closer look.
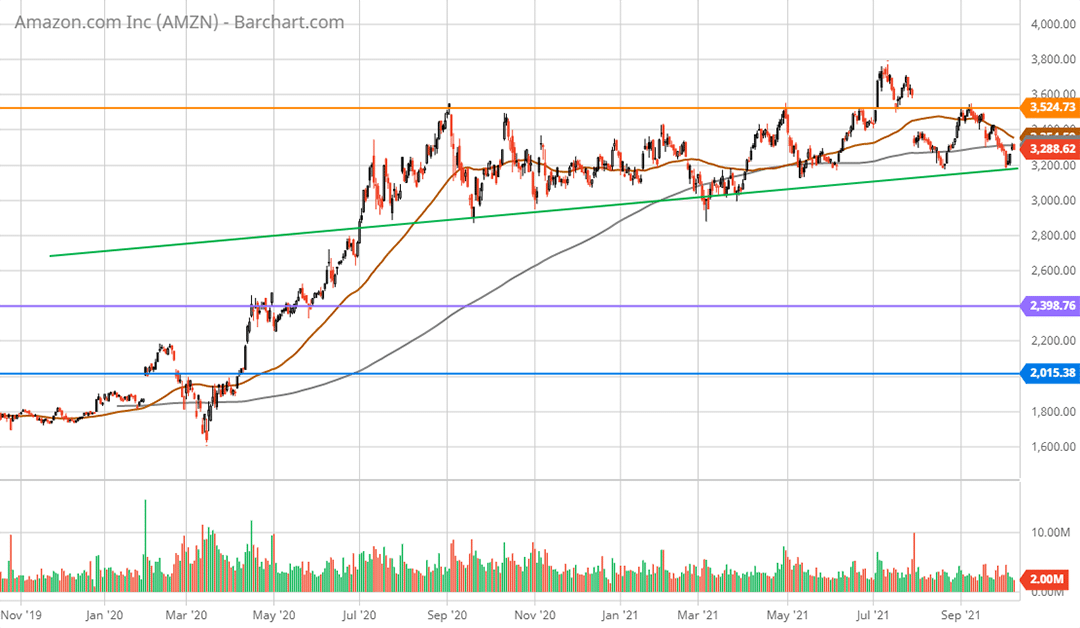
Amazon 2-year daily chart. Created by Brian Kapp using a chart from Barchart.com
Based on the fundamental backdrop, $2,400 appears likely to be tested and would offer the nearest opportunity to accumulate Amazon’s shares at an attractive risk/reward level. I suspect this area will offer firm support barring recessionary conditions. Furthermore, a correction to this level would be a 27% drop from current levels. This is well within expectations given the elevated valuation discussed above and the risk of lower-than-expected growth. The blue line near $2,000 looks to be a worst-case scenario as things stand and should be very firm support.
Summary
Amazon has been firing on all cylinders the past 18 months as it was arguably the largest beneficiary of the COVID lockdowns by absolute revenue growth. It was the perfect storm for Amazon to take market share as the world’s population was under lock down and social distancing requirements. As COVID recedes into the rearview mirror, Amazon investors face a period of heightened risk as the reversion to underlying organic growth takes hold.
The risk level is further amplified by the aggressive growth investment plan being implemented in response to the COVID demand boost. Amazon is investing heavily in physical infrastructure and employees compared to prior growth investment cycles at the company. This sets up the potential for rapidly increasing costs at a time of historic growth deceleration leaving profitability exposed to substantial disappointment.
With that said, Amazon has a history of outperforming the competition with a dominant position in e-commerce and cloud computing. For investors looking for a blue-chip growth opportunity, Amazon looks to be an attractive purchase in the $2,400 area with risk down to $2,000.
Price as of report date 10-12-21: $3243
Amazon Investor Relations Website: Amazon Investor Relations