Health care services is the final industry of the top eight, as covered in “Sector strategies for navigating 2023.” The underlying theme of the opportunities discussed throughout the top sector choices is the relative attractiveness of the small to mid-cap stock universe in the US. There are two factors underlying this reality.
First, the sheer number of opportunities in the small to mid-cap segment far exceeds what is available in the large to mega caps. There are simply more opportunities from which to choose. For example, expanding the opportunity set to the S&P 1500 Total Market Index triples the number of opportunities compared to the S&P 500 Index. Viewing the companies by industry rather sector doubles the number of opportunity vectors from 11 to 21.
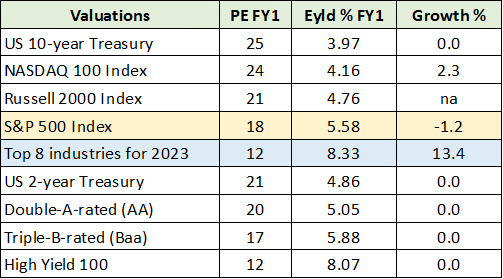
The second factor at play is the large number of small to mid-cap companies which trade at discounted valuations, while offering attractive growth potential. For example, the forward PE multiple of the top eight industry choices for 2023 is 12x and the estimated earnings growth rate is 13.5%.
An 8.3% earnings yield projected to grow in the mid-teens annually over the next three to five years is relatively attractive today. The relative attractiveness is clear when viewed against the following market backdrop. I have highlighted in blue the top eight industries and in yellow the nearest stock market index.
Please note that the industry growth rate (highlighted in blue) is an annual estimate over a three-to-five-year time frame, while that of the S&P 500 and Nasdaq 100 are the year ahead earnings growth estimates.
Health Care Services Industry
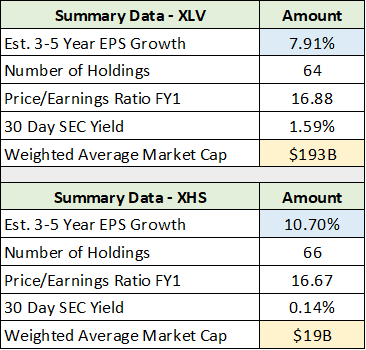
The health care services industry, as represented by the SPDR® S&P® Health Care Services ETF (NYSEARCA:XHS), is unique in comparison to the top eight. The valuation multiple is the highest of the top industries at 17x forward estimates. Summary data for the industry is displayed below alongside the same data for the Health Care Select Sector SPDR® Fund (NYSEARCA:XLV). The XLV tracks the market-cap-weighted health care sector within the S&P 500 index.
I have highlighted in blue the estimated earnings growth rate for each and in yellow the weighted average market cap. Notice that the weighted average market cap is $19 billion for the XHS portfolio compared to $193 billion for the XLV. While each portfolio carries a forward PE of 17x, the expected growth rates are materially different at 11% for the XHS and 8% for the XLV.
The small to mid-cap exposure in the XHS opens the door to significantly higher growth at a slightly lower valuation multiple compared to the market-cap-weighted health care sector.
Sub-Industries
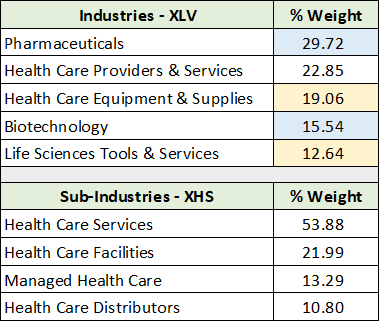
The health care services sub-industry is the largest weighting within the XHS at 54%. A comparison of the sub-industry breakdown within the XHS and the XLV highlights the differences between the two in terms of health care industry exposure.
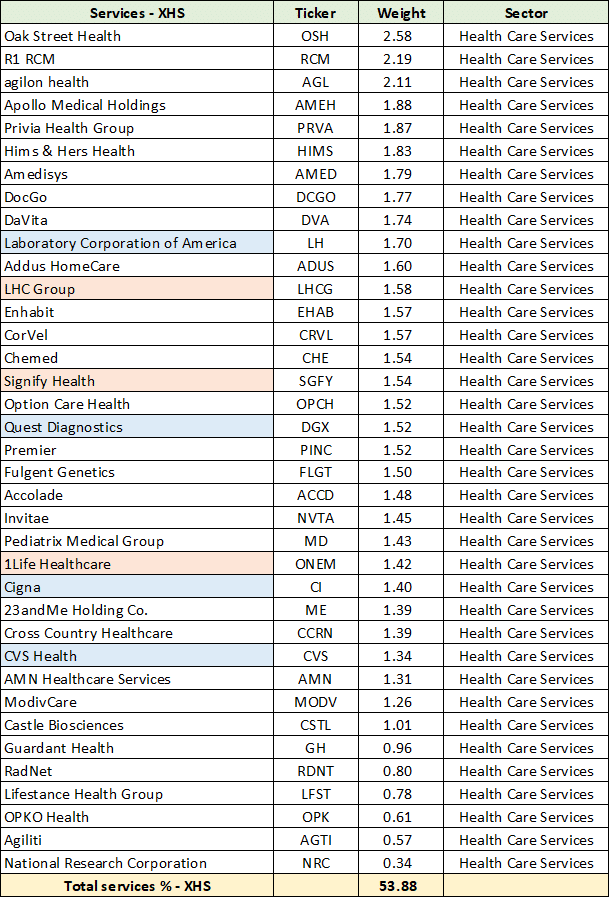
I have highlighted in blue those sub-industries which are not represented in the XHS and in yellow those with a marginal weighting in the XHS. Taking an industry approach offers materially different health care exposure compared to the market-cap-weighted sector approach. The following table displays the health care services sub-industry within the XHS.
I have highlighted in blue those companies that are also in the XLV. They account for roughly 5% of the XHS and 10% of the health care services sub-industry exposure in the XHS. Approximately 80% of the above companies could be considered growth companies.
In fact, three of the above companies, or 8%, are in the process of being acquired (the orange highlighted cells). Amazon is acquiring 1Life Healthcare for $3.9 billion, CVS is acquiring Signify Health for $8 billion, and UnitedHealth Group is acquiring LHC Group for $5.4 billion. The M&A activity highlights the attractive growth profile of the industry.
Health Care Facilities
The second largest sub-industry within the XHS is health care facilities at 22% of the portfolio. In comparison, the XLV facilities weighting is just over 1%, highlighting a distinct difference between the two approaches. The following table displays the holdings in the XHS.
I have highlighted in blue the one overlapping company with the XLV. An important risk factor for the facilities sub-industry is elevated debt levels. As a result, I have highlighted in orange those companies in the group that are especially at risk. They account for 5.6% of the total XHS portfolio.
For those that take a more customized portfolio approach, the three at risk companies could be swapped for better alternatives. Nonetheless, the facilities sub-industry offers generally attractive valuations and related growth profiles.
Managed Care
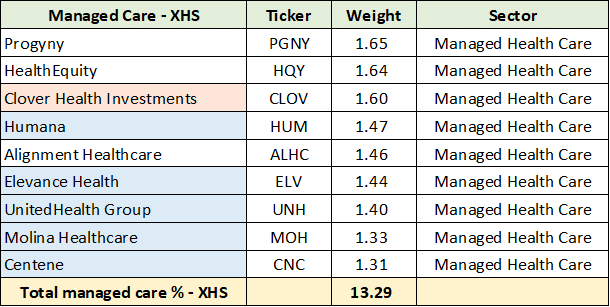
The managed care sub-industry comes in third within the XHS at 13% of the portfolio. There are many overlapping companies with the XLV, which are highlighted in blue below. The five companies comprise 14% of the XLV, with UnitedHealth Group comprising 9% of the total XLV compared to 1.4% of the XHS.
I have highlighted in orange the company in the XHS that is questionable and would be a swap candidate for more customized portfolios. Clover aside, the more diversified exposure within the XHS is a distinct positive compared to the heavy overweight in UnitedHealth Group in the market-cap-weighted XLV. Valuations in UnitedHealth’s peer group are materially lower while their growth potential is comparable.
Distributors
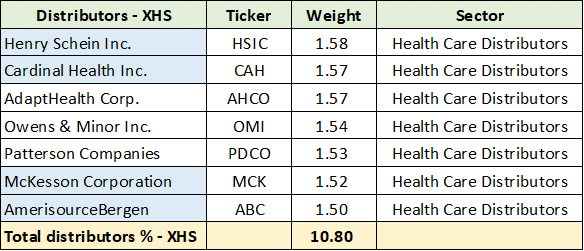
The final sub-industry is distributors, which represent 11% of XHS. While four of the seven companies overlap with the XLV (highlighted in blue below), the total weight of the four in the XLV is only 2%
The added 11% weighting for the distributors in the XHS compared to the XLV is a net positive given the heightened risk of valuation compression underlying today’s market environment. Distributors generally trade at deeply discounted valuations compared to the sector and market averages.
Technicals
Turning to the technical setup, the health care services industry is in a long-term uptrend. The price action since 2015 is best described as a long consolidation pattern within a secular bull market. On the following monthly chart, the lower green line represents the 2015 top and the gold line is the 50-month moving average. The moving average has served as support during the long uptrend.
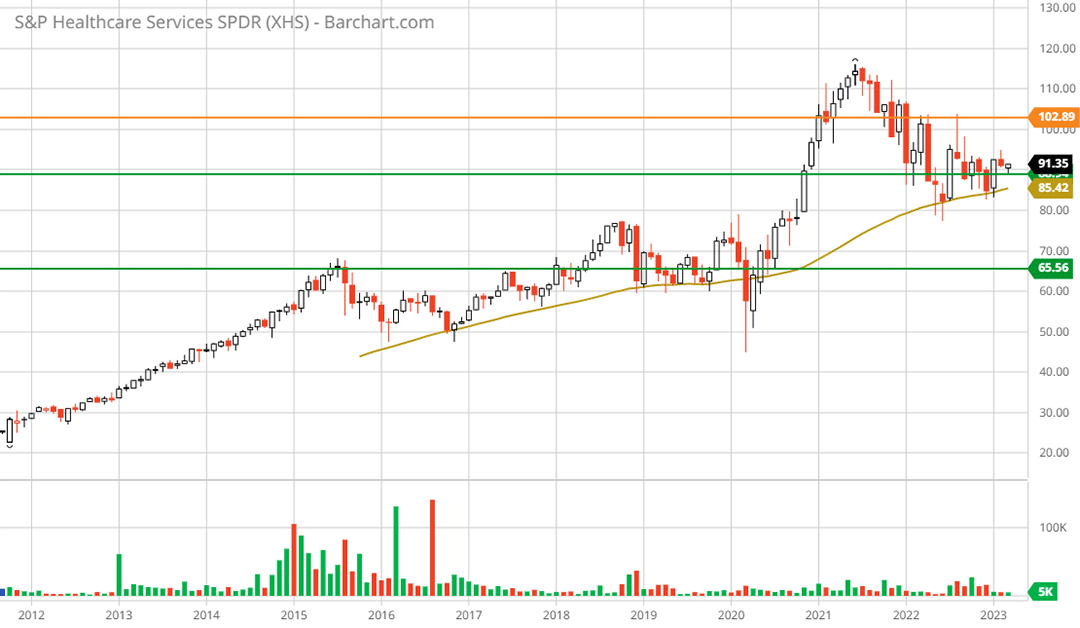
SPDR® S&P® Health Care Services ETF XHS monthly chart. Created by Brian Kapp using a chart from Barchart.com
The following 5-year weekly chart zooms in on the post-Covid attempt to resume the long-term uptrend following the long consolidation trend which began in 2015.
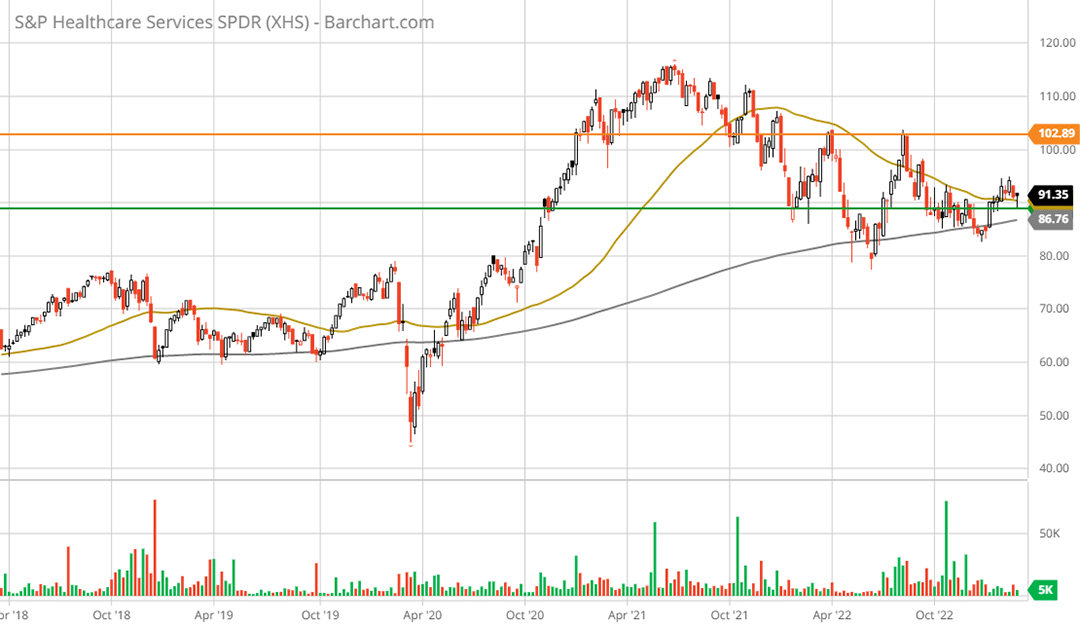
SPDR® S&P® Health Care Services ETF XHS 5-year weekly chart. Created by Brian Kapp using a chart from Barchart.com
The gold line depicts the 50-week moving average and the grey line is the 200-week moving average. Technically speaking, the health care services industry is in a bull market and testing support (the green line). The following 1-year daily chart zooms in on the recent year-long bottoming process and nearby support.
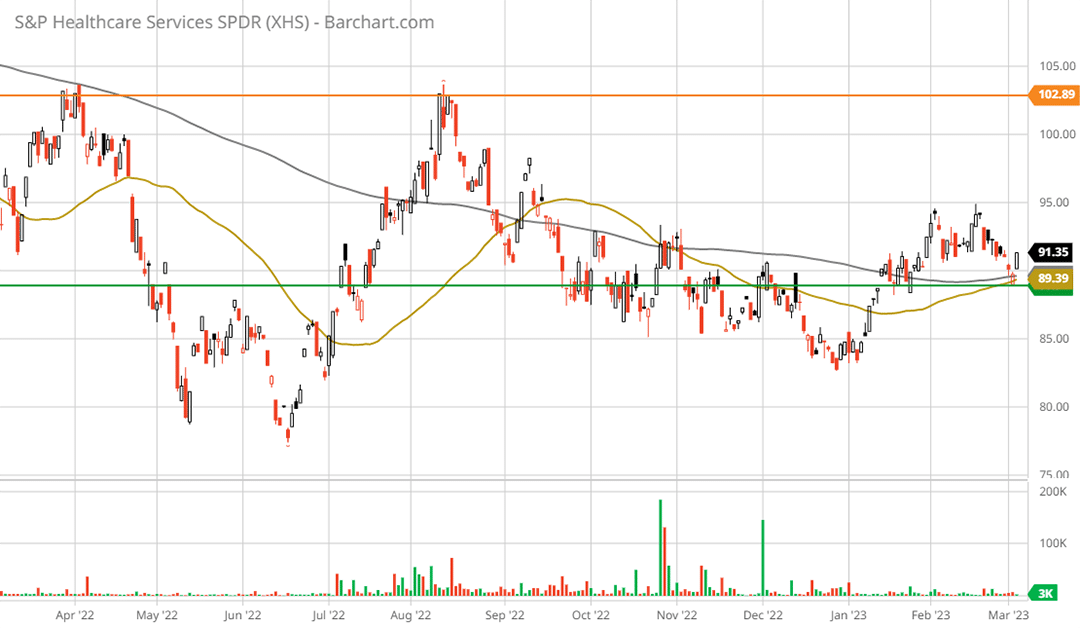
SPDR® S&P® Health Care Services ETF XHS 1-year daily chart. Created by Brian Kapp using a chart from Barchart.com
The industry is bouncing off of what should be a strong support level, though the 50-day moving average remains beneath the 200-day moving average. Within the context of the bull market trend displayed in the weekly and monthly charts, a reversal to the upside is well supported.
Summary
The health care services industry offers timely diversification given the uncertain macroeconomic environment. Though the industry trades at the highest valuation multiple of the top eight industries for 2023, there is a wide dispersion between growth and value stocks within the group.
The growth companies are relatively attractive given the aforementioned macroeconomic uncertainty and the non-cyclical nature of health care. This is especially the case when combined with the ongoing valuation correction, which should continue to be a drag on traditional growth favorites.
The value stocks within the industry tend to be discounted rather deeply compared to other sectors and market averages. This opens the door to material multiple expansion potential. The recent M&A within the industry by Amazon, CVS, and UnitedHealth Group sends a strong signal.
When combined with the top industries for 2023, the health care services industry offers a uniquely diversified, asymmetric risk/reward opportunity.


