Risk/Reward Rating: Neutral
Akamai bills itself as the pioneering leader of the intelligent edge that makes digital experiences fast, intelligent, and secure for the world’s leading brands. In an age of exploding connectivity, connected devices, and edge computing, Akamai is well positioned as the intelligent edge company. Akamai provides its technology services via one of the largest distributed networks, blanketing the world with over 4,200 physical network locations.
The company has two primary business segments, the Edge Technology Group (62% of revenue, includes the CDN or content delivery business) and the Security Technology Group (38% of revenue). In the recently reported second quarter, the Edge Technology Group reported revenue down 1% versus 2020 while the Security Technology Group grew revenue 25%. Overall, sales grew 7% which is in line with the expected revenue growth for the 2021 full year. Akamai has been a steady grower over the years and should continue to grow faster than the overall economy over the business cycle.
It should be noted that the small sales decline in the Edge Technology Group in 2021 is due to a spike in business in 2020 caused by the COVID lockdowns and the resulting surge in demand to deliver video, gaming downloads and social media content. This business should continue to grow in line with the growth rate of the internet and network content overall.
The Security Technology Group is primed to grow at a rapid pace given recent high-profile security breaches and the increasing focus on privacy and data protection by the world’s governments. A sampling of security applications that are in high demand includes the web app firewall, denial-of-service attack prevention, bot management and denial, page integrity management and customer data protection, and audience high jacking prevention. Akamai has the ability to seamlessly package security services with edge computing and content delivery services which enables customers to consolidate and simplify their technology implementations.
Given the healthy long-term business outlook, the outlook for Akamai’s stock depends on the valuation. Consensus earnings estimates are presented on a non-GAAP basis (generally accepted accounting principles) which excludes material and recurring stock-based compensation expense. On this basis, Akamai is valued at 20x 2021 earnings estimates and 18.4x 2022 estimates. On a GAAP basis, the valuation is approximately 30x 2021 estimates and 27.5x 2022 estimates. Akamai consistently uses its free cash flow to repurchase shares to offset the dilution from employee stock-based compensation. As a result, the GAAP earnings and valuation figures best reflect economic reality.
While the GAAP valuation is high in a historical stock market context, it is less so when compared to much of the technology sector today. Looking at expected sales for 2021, Akamai is trading at 5.5x sales. For comparison, Fastly (FSLY) is a direct competitor and trades at 14x estimated 2021 sales and is unprofitable. All told, the valuation appears to be full at the current price leaving little room for excess return potential. Looking forward, opportunistically accumulating the shares on price weakness should be a rewarding strategy.
Technicals
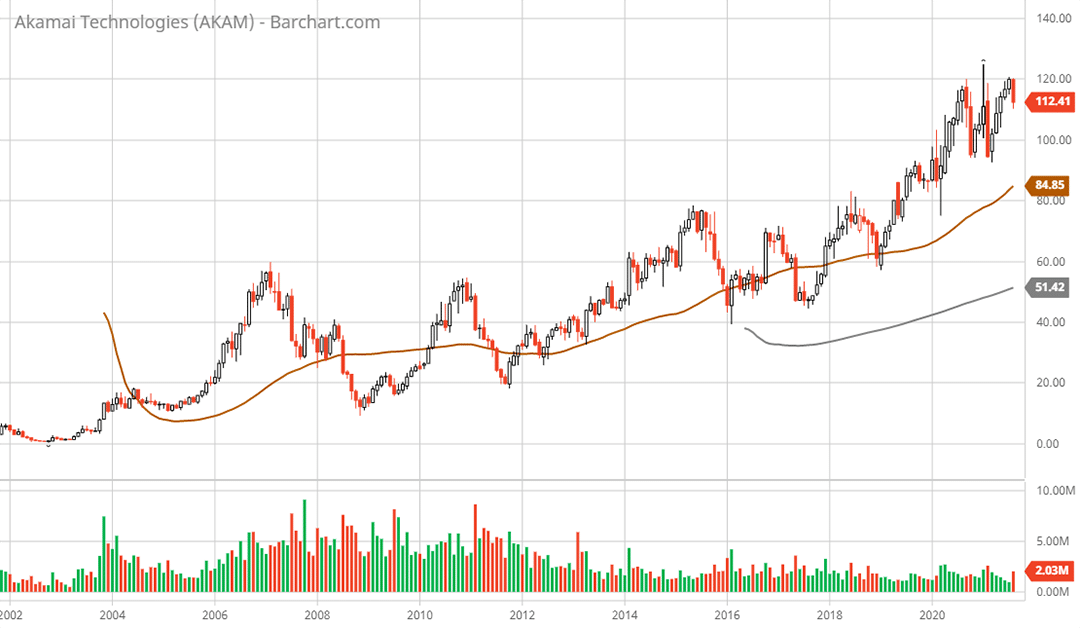
Technical backdrop: Akamai came public at the peak of the internet mania in 1999 and peaked at $350 per share before crashing. Since November of 2002, the stock has been in a long-term choppy uptrend. The choppiness (volatility) provides opportunities for new investors to accumulate the shares at attractive prices. The last major opportunity occurred in 2016 and 2017 in the $45 area. This happened to be near the 50-month moving average (brown line on the long-term monthly chart) which currently stands at $85.
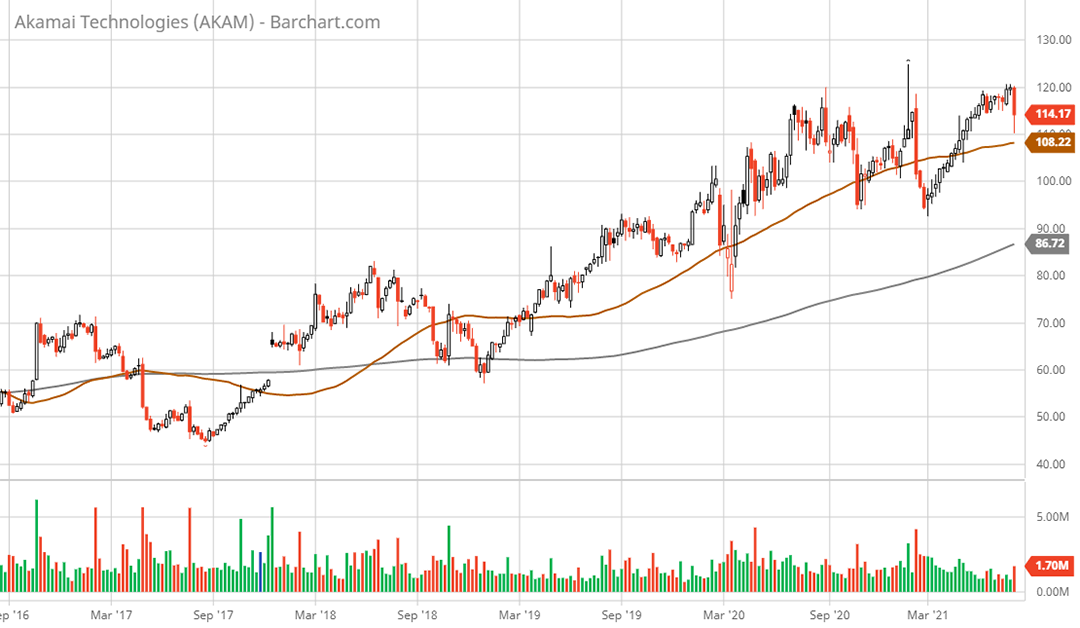
Looking at the 5-year weekly chart, support levels are present at $90, which was 2019 resistance, and $80, which was 2018 resistance. The 200-week moving average (grey line on the 5-year weekly chart) stands at $86 which confirms the strong support zone.
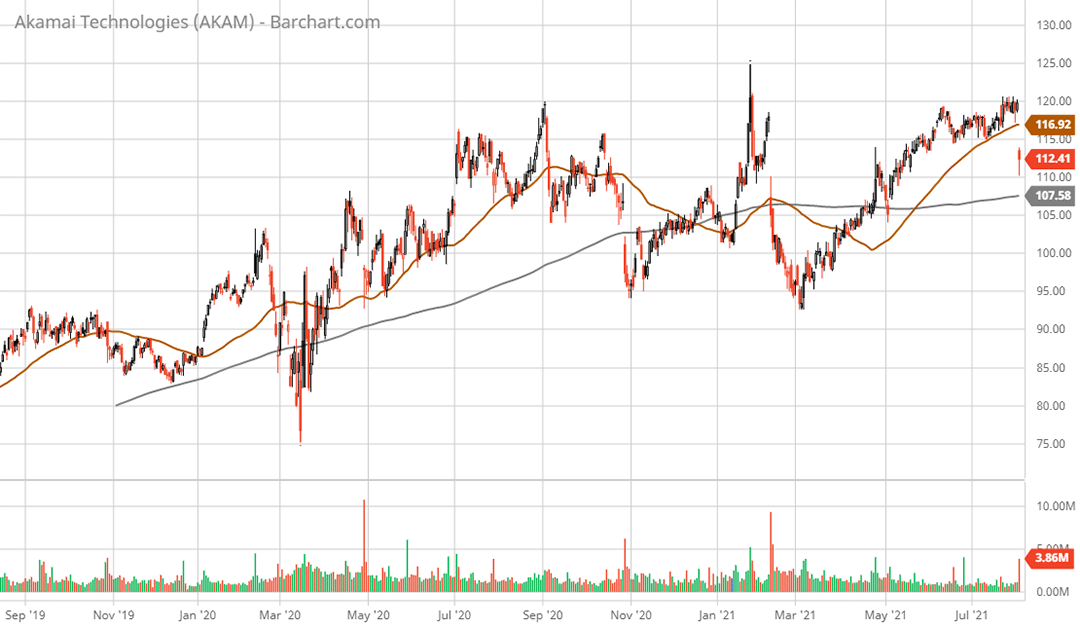
Zooming in to the daily chart, Akamai gapped lower on the recent earnings release which was likely due to the small decline in sales for the Edge Technology Group. The gap lower should create strong resistance at the current level up to the $120 area which is near the 50-day moving average (brown line on the 2-year daily chart). The stock has received support in the low $90’s over the past year which aligns well with the 2019 resistance area and the longer-term trend lines outlined above. This level would undercut the 200-day moving average (grey line on the 2-year daily chart) setting up a potential bearish psychology moment and offering a potential entry point in the longer-term support area.
Technical resistance: current levels up to $120.
Technical support: $90 area then $80.
Price as of this report 8-5-21: $112.41
Akamai Investor Relations Website: Akamai Investor Relations
All data in this report is compiled from the Akamai investor relations website and SEC filings, and where applicable publicly available information regarding consensus earnings estimates.


