Risk/Reward Rating: Neutral
Airbnb stock has been subdued after reporting second quarter 2021 earnings on August 12. The muted reaction thus far is due to many moving parts within the business, both positive and negative. The divergent trends in the business are further complicated by the resurgence of COVID globally, which continues to create a highly dynamic and volatile operating environment for Airbnb.
The Positive
On the positive side, the dollar value of gross bookings in Q2 2021 came in 37% higher than in Q2 2019. Using 2019 as the base year for comparison best reflects the reality of Airbnb’s business trends, as the company was devastated in Q2 2020 due to COVID and the resulting collapse in travel. The increase was driven by North America (primarily the US) as the volume of nights and experiences booked grew 25% over Q2 2019. Latin America chipped in with 15% volume growth. These volume gains were offset by continued declines across the rest of the world compared to 2019.
The Negative
On the negative side, total nights and experiences actually declined by 1% in Q2 2021 compared to Q2 2019 and are expected to decline again in Q3 2021 compared to 2019. Total nights and experiences are a volume measurement of Airbnb’s business. Given the 37% growth in the dollar value of bookings in Q2, Airbnb is benefitting from higher prices in the face of overall declining volumes. The volume decline globally is concerning when viewed against a backdrop of pent-up travel demand after a year of COVID lockdowns.
The company attributes higher prices to a mix shift in the business as a result of COVID, which it believes will persist into the future. The largest shifts in the business mix included longer stays, stays at non-urban properties, properties located primarily in North America, and a trend toward renting entire homes. Each of these factors contributed to a massive 40% spike year over year in average daily revenue per night to $161.
Given the highly unusual operating environment due to COVID, there are uncertainties as to whether these higher price market shifts are sustainable or whether they reflect more pent-up COVID peculiarities. This is an important question for Airbnb as the 40% spike in dollar value per rental unit has materially enhanced Airbnb’s profitability compared to historical trends as can be seen in the following cash flow summary by year.
The operating cash flow through the first six months of 2021 dwarfs the entire year of cash flow in both 2019 and 2018. It should be noted that the first half of the year produces more cash flow than the second half due to the timing of receiving funds prior to providing services during the peak travel season in the summer. Management’s commentary around the second half of the year would suggest this cash flow outperformance will persist versus 2018 and 2019.
Valuation Extremes
All told, Airbnb is a mixed bag at the moment. While there is a glimmer of hope for enhanced profitability, there is also a drag on the stock given its high valuation. The company is not projected to be profitable in 2021. In 2022 the current estimates are for $.17 per share of earnings. This places the valuation at 876x 2022 earnings per share estimates. The current market value of Airbnb stands at $91 billion which is 71x current cash flow from operations assuming Airbnb were to be cash flow neutral for the remainder of 2021. The company has historically had cash outflows in the second half of the year. Finally, at the current revenue run rate, Airbnb is trading at roughly 20x sales. Each valuation metric is extreme from a historic market perspective.
A high valuation combined with extreme business mix shifts caused by COVID create an elevated risk level for Airbnb’s stock at the current price. On the bright side, the platform nature of the business model and the brand equity built up over the past decade should support a premium valuation. As a result, accumulating Airbnb shares on substantial price declines could offer an excellent long-term investment opportunity while providing a more attractive margin of safety.
Technicals
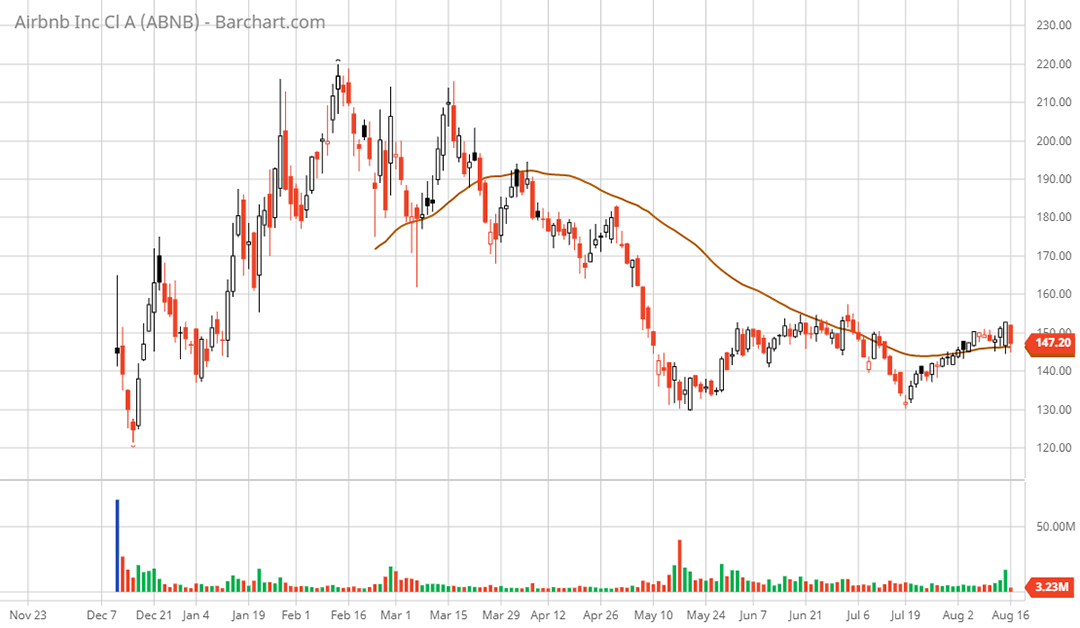
Technical backdrop: Airbnb stock is currently trading where it ended its first day as a public company in December of 2020. The stock made a two-month run higher after the IPO and peaked coincident with the most speculative phase of the current bull market in February 2021. During the peaking process in Q1 2021, Airbnb stock formed a head and shoulders top with the $180 area serving as the shoulder support level. This support was broken in April 2021 and quickly became resistance as the stock was rejected and fell $50 before bouncing in May 2021.
Since topping Airbnb is now down 33% and has spent the past three months in a sideways trading range in an attempt to form a sustainable bottom. The trading range is bounded by $130 on the downside and $155 on the upside. The stock is currently resting on support at the 50-day moving average (brown line on the daily chart) in the $146 area.
Technical resistance: $155 has served as resistance during the recent sideways trading range. This is followed by the $170 to $180 range which should offer heavy resistance given the head and shoulders top pattern in Q1 2021.
Technical support: The current level offers some support at the 50-day moving average and coincides with the psychologically important IPO price. Next lower support is at $130 which has served as the bottom for the recent trading range, which is then followed by the all-time low at $120.
Price as of this report 8-16-21: $149
Airbnb Investor Relations Website: Airbnb Investor Relations
All data in this report is compiled from the Airbnb investor relations website and SEC filings, and where applicable publicly available information regarding consensus earnings estimates.


