As the outlook for the broad capitalization-weighted indices in the US is clouded by higher interest rates and extended valuations, it is a suitable time to look for opportunities under the market surface. The following section from “New bull market or a bear market bounce?” summarizes the situation facing investors.
New Bull Market or Bear Market Bounce?
The fundamental and technical signs point to the broad US stock market nearing a short-term peak. Technically, the head and shoulders neckline from the topping process looms large. From a fundamental perspective, valuations remain extended in relation to the historical evidence and near-term earnings growth.
In terms of opportunities in the broad stock market, valuation compression remains the primary risk. This is supported by the outlook for higher long-term rates and the current earnings contraction in the Nasdaq 100.
As a result, the relative opportunities in the stock market reside in those segments and sectors which are trading at discounted valuations. These opportunities are prevalent in the small to mid-cap value segments of the US market and stretch into the large-cap segment.
Sector Opportunities
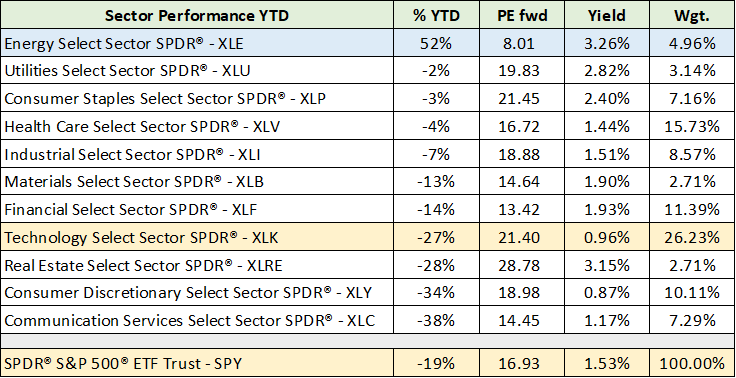
As the primary risk today is multiple compression, and valuations are more elevated in large-cap stocks, viewing sectors in greater granularity helps illuminate the opportunity set. The broadest manner in which to view sector opportunities is using the 11 GICS sectors, as was done in my report “Technology outlook for 2023.” The following image is from the report:
The drawback of the above approach, which uses the S&P 500 index as the stock market opportunity set, is that the largest companies dominate the indices. Additionally, many sectors are quite diverse, thereby limiting exposure to the total opportunity set.
Expanding the View
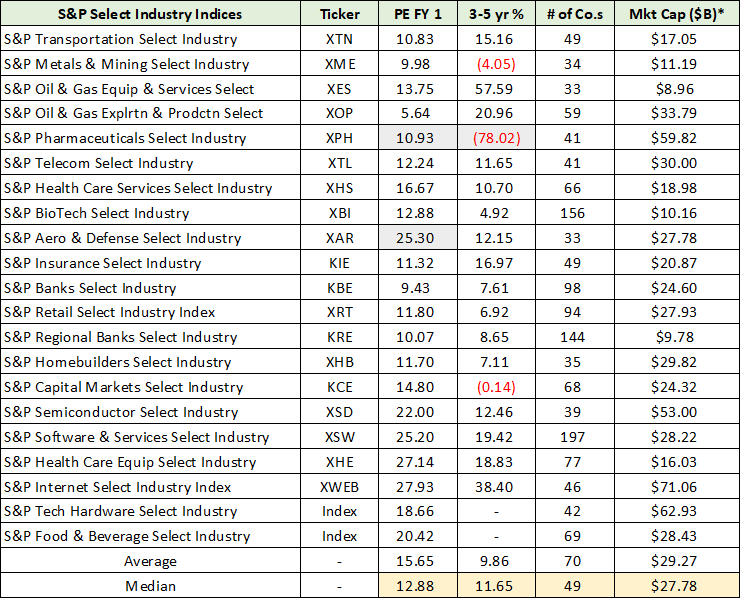
The S&P 1500 Total Market Index (NYSE:SPTM) triples the opportunity set to 1,500 companies. By viewing the opportunity set by industry rather than sector, the number of opportunities doubles to 21 from 11. The industries and representative ETFs are displayed below. I have highlighted in yellow key summary metrics for the industry groups. The ETF data was compiled from State Street and the Index data from S&P Global.
I have highlighted in grey the cells that are heavily influenced by outliers and thus should be taken with a grain of salt. State Street describes the weighting methodology within the industry ETFs and the benefits of this approach as follows (emphasis added):
…a modified equal weighted index which provides the potential for unconcentrated industry exposure across large, mid and small cap stocks… Allows investors to take strategic or tactical positions at a more targeted level than traditional sector based investing.
Industry Opportunities
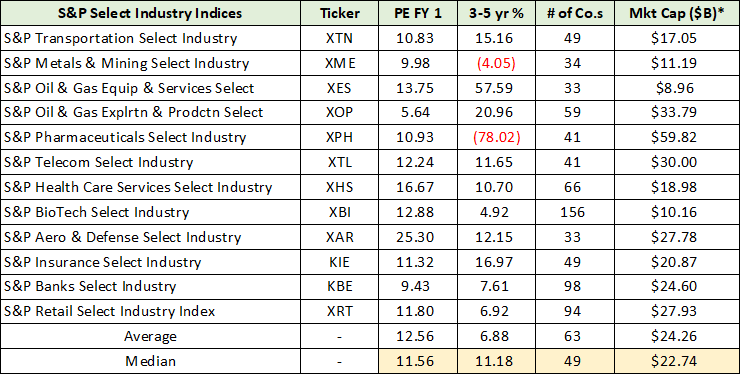
The Nasdaq 100 and S&P 500 are trading at 25x and 19x forward earnings, respectively. With a 13x median PE multiple on the above industry groups, it is evident that there are opportunities under the market-cap-weighted surface. 12 of the industries offer a decidedly positive risk/reward setup, albeit to varying degrees. They are displayed below. I have highlighted in yellow the key summary metrics for the group.
Using the median, a portfolio constructed of the above industries would offer an 8.65% earnings yield at an 11.56 PE. This is quite favorable compared to the market yields reviewed in “New bull market or a bear market bounce?” The market-cap-weighted indices have an earnings yield of 4% to 5.5%, while the bond market offers yields in the 5% to 8% range.
While the bond market is more competitive, the income stream does not grow. Using the median, the above group offers an expected annual earnings growth rate of 11.18%. If consensus estimates are in the ballpark, the above group offers a decidedly asymmetric risk/reward opportunity. In other words, there is much room for error and a margin of safety is embedded in the current prices.
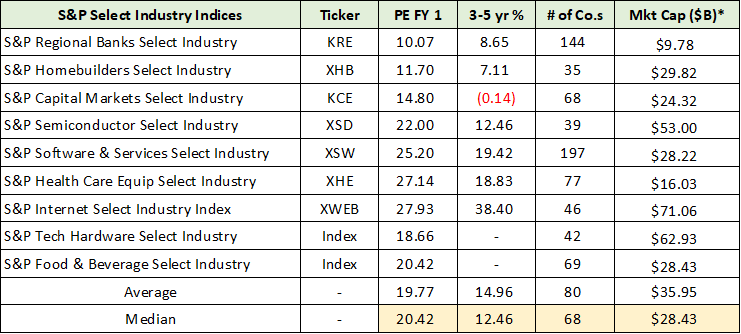
The industries which were excluded from the positive risk/reward list above are displayed below. Notice the yellow-highlighted summary data. As the primary risk today is valuation compression and the median PE of the group is 20.42, the primary short-term market risk is substantially mitigated. This is accomplished with a marginal reduction in the expected growth rate over three to five years.
The three lower-multiple industries at the top of the list were removed due to short-term cycle dynamics. Real estate markets remain in limbo due to higher rates, which should pressure the builders. Stress in commercial real estate markets is likely to reverberate throughout the regional banks. Both create headwinds for capital markets, while opening the door to fat-tail events.
Top Industries for 2023
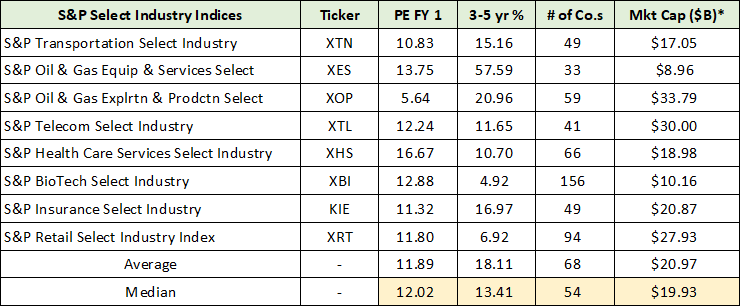
Winnowing through the 12 positively-rated risk/reward opportunities results in the top eight for 2023, which are displayed below. The valuation of the top eight increases the median PE by 4% in comparison to all 12. This is a marginal increase in valuation compression risk. On the other hand, the expected growth rate increases by a material amount and represents a 20% higher growth rate.
Biotech Industry
The positive risk/reward rating for the S&P BioTech Select Industry (NYSE:XBI) is both strategic and tactical in nature. Strategically, the ongoing valuation compression across markets is centered on sectors that growth investors traditionally favor. Technology-related industries have been the top choice traditionally and are especially vulnerable in today’s market environment.
The biotech industry is a natural opportunity set for growth investors. In terms of timeliness, the industry has little exposure to macroeconomic conditions. Additionally, today’s more acute macroeconomic risk factors do not directly affect the biotech industry. As a result, the industry is likely to become an increasingly attractive option relative to traditional growth-investor favorites.
The near-term relative opportunity is both a tactical and strategic consideration. Thinking longer term, and with the hindsight of a global pandemic, it is hard to imagine an industry that offers more upside asymmetry than biotech. Strategically speaking, given the asymmetric upside potential in the industry, it is an ideal investment option for diversified growth portfolios.
Technicals
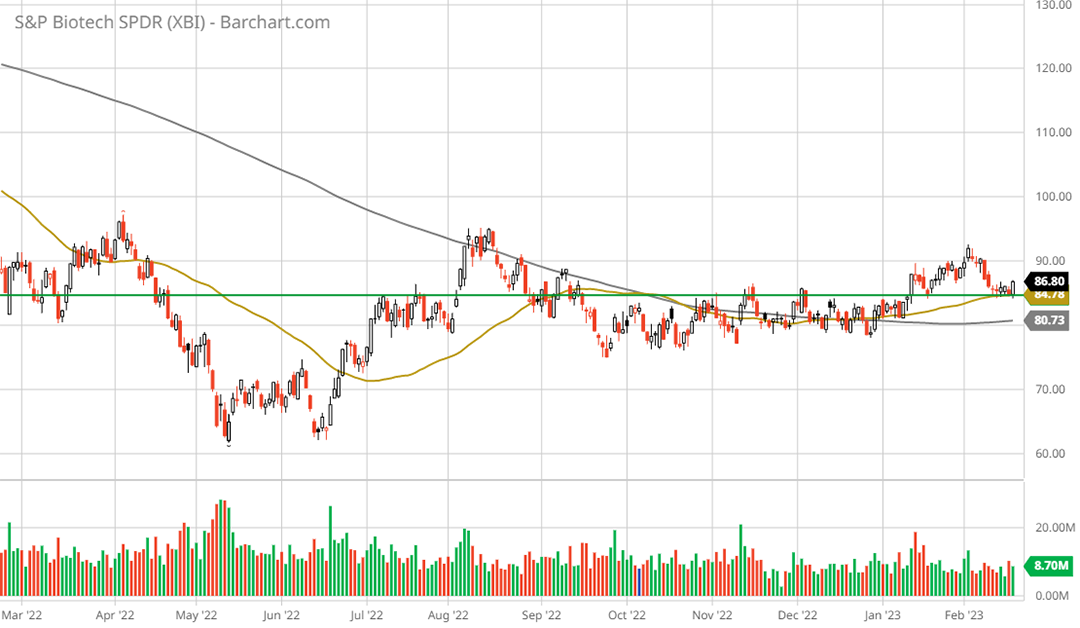
Turning to tactical considerations, the technical backdrop for biotech points to a positive risk/reward asymmetry. The following 1-year daily chart depicts the year-long bottoming process and the more recent consolidation phase.
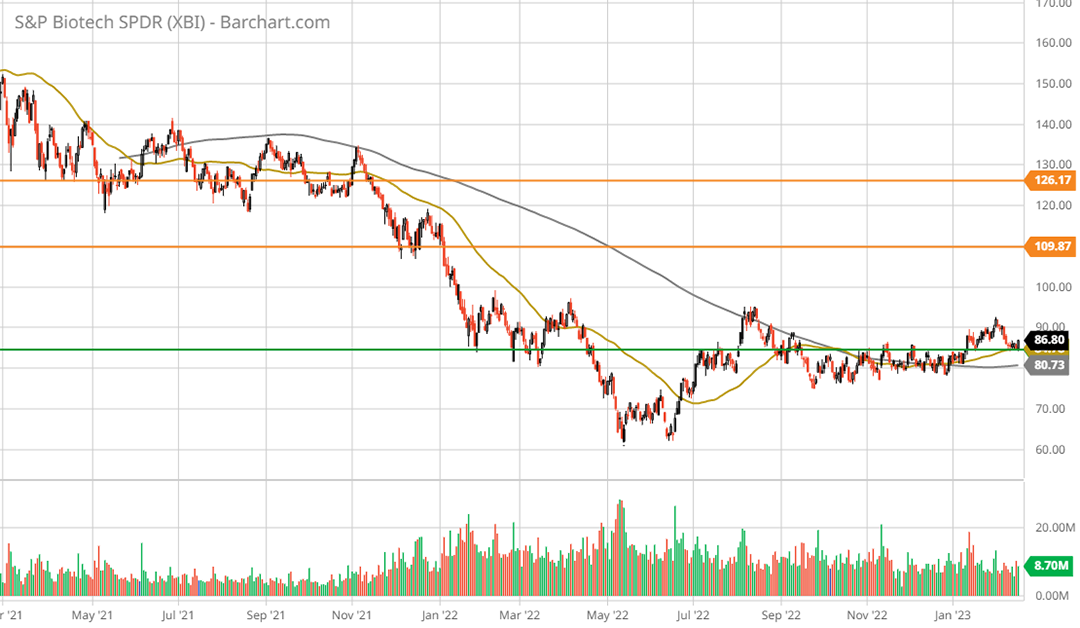
Notice that the 50-day moving average (the gold line) recently crossed above the 200-day moving average (the grey line). This is a bullish price signal following a long bottoming and consolidation process. The green line represents a primary support level, from which the shares recently bounced. Stepping back, the 2-year daily chart below provides a look at the key resistance levels. They are represented by the orange lines.
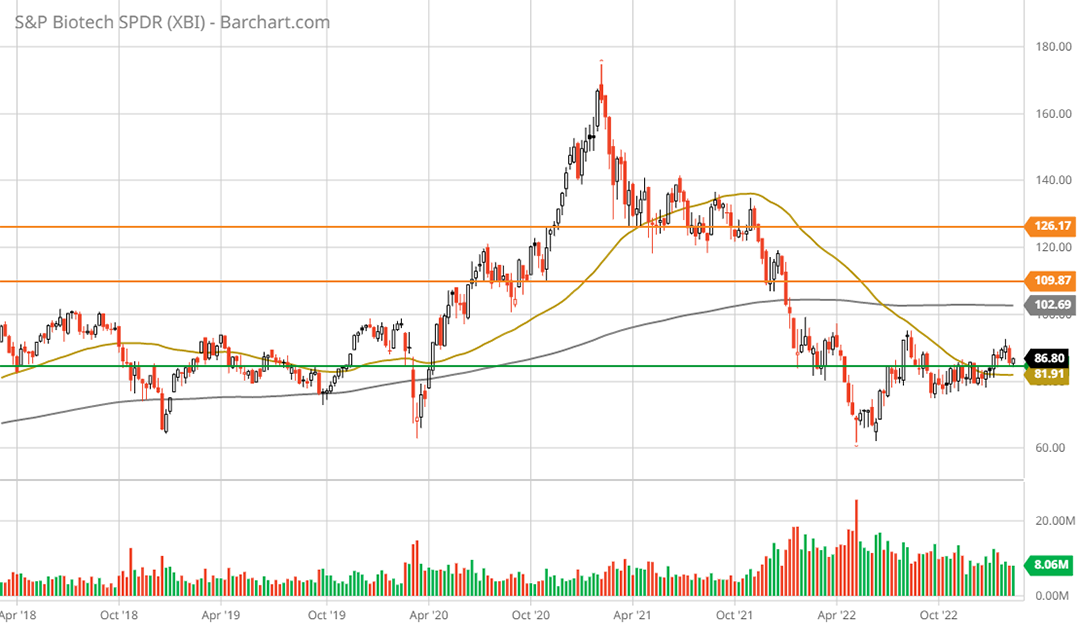
The upside potential to the two resistance levels is 27% to 45%, respectively. Technically speaking, these targets are easily achievable over the short term. The following 5-year weekly chart provides a larger perspective within which to view the upside targets.
The monthly chart below adds important context to the key support level highlighted by the green line.
The primary support level dates back to the 2015 top and the long sideways consolidation that occurred between 2017 and 2020. Technically speaking, the biotech industry is sitting on top of what should be an incredibly strong support level.
Summary
The biotech industry represents a tactical overweight opportunity while operating within secular growth undercurrents. Growth investors are likely to gravitate toward the sector as it is structurally skewed toward extreme upside asymmetry, as was evidenced by the pandemic. As the technical backdrop mirrors the fundamental asymmetry, the risk/reward is decidedly skewed to the upside.
I will cover the remaining top seven sector opportunities for 2023 in subsequent reports.


