
The above photo of New York City literally depicts the Vornado Realty Trust (NYSE:VNO) opportunity. As the saying goes, real estate is about three things: location, location, and location. As there is much truth in the saying, discounted prices in the above neighborhood present a truly unique asset opportunity.
Risk/Reward Rating: Positive
Most would agree that the above photo represents some of the most valuable real estate in the world. The Vornado opportunity is courtesy of commercial office space being one of the least attractive real estate sectors today, due to the post-COVID remote working trend. Commercial office space comprises 77% of Vornado’s real estate portfolio with retail space accounting for much of the remainder.
“Never bet against America.” – Warren Buffett
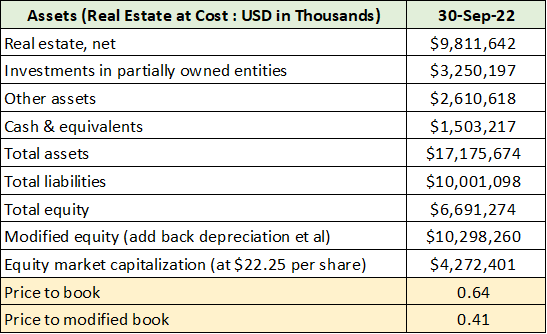
As the negative sector outlook is well known, the question turns to valuation and what is priced into Vornado’s shares. For asset opportunities, the balance sheet is a natural starting point. The following table was compiled from Vornado’s Q3 2022 10-Q filed with the SEC. It displays key balance sheet items and my calculations.
Created by Brian Kapp, stoxdox
I have highlighted in yellow the price-to-book ratio, 0.64x, using Vornado’s reported equity value on its balance sheet. A key feature of real estate’s attractiveness as an investment is that it generally appreciates rather than depreciates over time.
As a result, I modified the equity value by adding back accumulated depreciation which results in a modified price-to-book ratio of 0.41x. Please note that the modified version is my creation and is not a reported statistic.
Trading at 0.64x its reported book value and 0.41x my modified book value, it is fair to say that the negative sector outlook has been priced in. Vornado’s valuation compared to that of its sector peers confirms the depth of the current discount, which is highlighted in yellow below.
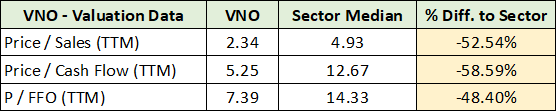
Source: Seeking Alpha. Created by Brian Kapp, stoxdox
The Portfolio
Vornado’s discount to the sector across the above valuation metrics ranges from -48% to -59%. This is similar to the -34% discount to book value and the -59% discount to my modified book value. A large portion of the Vornado investment case rests on the key question: is this discount range an accurate depiction of Vornado’s future value?
The following list from Vornado’s 2021 annual report provides an overview of the company’s real estate portfolio.
- 67 Manhattan operating properties.
- 6 million square feet of office space in 32 of the properties.
- 7 million square feet of street retail space in 60 of the properties.
- 1,674 units in eight residential properties.
- Multiple development sites, including Hotel Pennsylvania.
- A 32.4% interest in Alexander’s, Inc. (NYSE: ALX), which owns six properties.
- Signage throughout the Penn District and Times Square.
- The 3.7 million square foot theMART in Chicago.
- A three-building office complex in San Francisco’s financial district.
To use the game of Monopoly as a metaphor, Vornado is the equivalent of buying Boardwalk and Park Place, which is evident from a cursory glance at its full property list. For those interested, the company’s portfolio and PENN DISTRICT books provide a more detailed look at Vornado’s assets. Vornado offers a world-class real estate opportunity.
While the assets represent some of the most valuable real estate in the world, being largely in Manhattan, they are also surprisingly diversified from a tenant perspective. The following tables were compiled from the 2021 10-K and display Vornado’s tenant concentration and sales mix between office and retail properties.
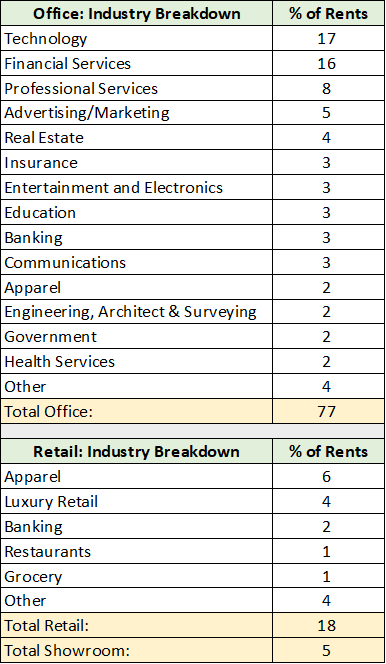
Created by Brian Kapp, stoxdox
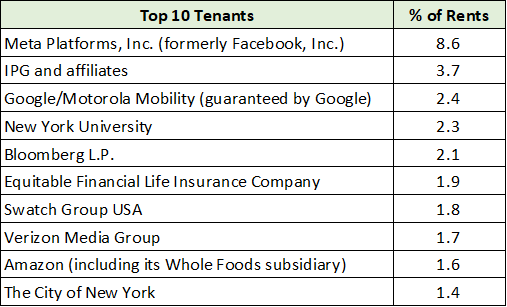
Created by Brian Kapp, stoxdox
The tenant list is high quality and well diversified across companies and industries.
Portfolio Conditions
In real estate, market conditions are well illustrated by occupancy and pricing. The following table, compiled from the 2021 annual report, displays these two metrics for Vornado’s office and retail properties each of the past five years, through the end of 2021. I have highlighted in yellow the metrics for 2019 and 2021 to illuminate pre- and post- pandemic trends.
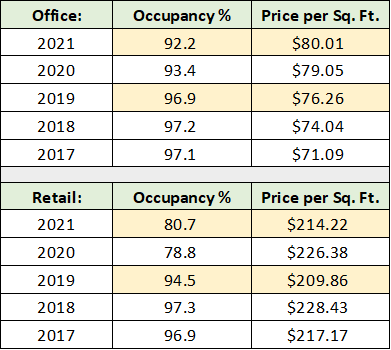
Created by Brian Kapp, stoxdox
Notice that office occupancy remains in a downtrend while retail occupancy bottomed in 2020. Vornado’s steep valuation discount likely reflects fears that office occupancy will trend in the direction of retail’s depths. The importance of location is on display in the pricing data. Vornado’s price per square foot is higher than in 2019, even as occupancy has deteriorated materially.
While occupancy is likely to remain challenged in the coming years, to date, Vornado’s premium location is providing ballast via pricing power. The dynamic at play is similar to that which played out in retail real estate over the past decade. During that time, shopping malls in less dense, lower income regions were decimated. They are an extreme example of real estate depreciation in action.
Such fears are clearly evident in Vornado’s price-to-book value discount of -34% and discount to modified book value of -59%. While valuations did adjust materially lower for high-end retail real estate, it was not fundamentally impaired like much of the mid to lower end of the market. Michael J. Franco, President and Chief Financial Officer of Vornado Realty Trust, put it succinctly on the Q3 2022 earnings call:
Retailers are focused on the best locations.
Both offline and online retailers continue to value prime locations and increasingly realize that a physical footprint is necessary for long-term success.
A similar dynamic is likely to unfold in the commercial office market. Many CEOs have expressed urgency in returning key employees to physical offices. I view it to be self-evident that key employees require common physical space, if less frequently, to create and successfully execute business plans as conditions change. New York is well-suited for a future in which key personnel must be within physical reach while many of the day-to-day tasks can be executed remotely.
Like the malls, there will be much pain ahead for commercial office real estate. Similar to the malls, prime locations are likely to fair relatively well longer term. As is evidenced by Vornado’s valuation discount, the market is pricing in a bleak future for the company, which may prove too pessimistic.
Fundamentals
Consensus estimates through mid-decade point to a continuation of the negative industry trends into 2024, with a rebound arriving in 2025. The following table displays consensus earnings or FFO (funds from operations) and sales estimates through 2025.
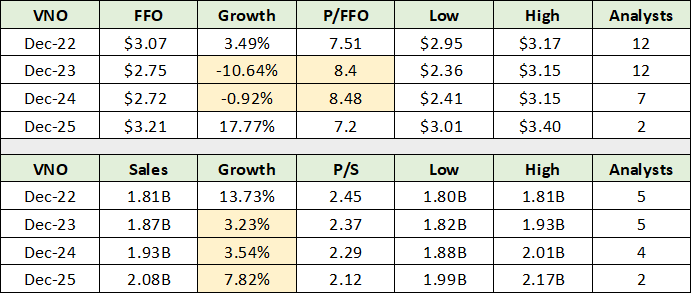
Source: Seeking Alpha. Created by Brian Kapp, stoxdox
I have highlighted in yellow the key data points. Earnings as represented by FFO, are expected to bottom in 2024, with the brunt of the decline projected to occur in 2023. Vornado’s valuation near 8.5x FFO translates into an earnings yield of 12% on trough expectations.
If estimates are in the ballpark, which appears to be a reasonable expectation, 12% is an extraordinary earnings yield on top-tier real estate. Recall from the previous valuation table that the sector median P/FFO is 14.33 and equates to a 7% earnings yield using FFO as the earnings proxy.
For additional context, yields on junk bond indices are near 8% today, while the small-cap Russell 2000 index trades at an expected earnings yield of 4.5% using consensus estimates for 2023. The small-cap index is a broad comparable index for Vornado, as it is a small-cap value stock.
Although industry conditions are expected to remain depressed through 2024, notice that Vornado is expected to grow sales through the downturn. Premium real estate and pricing power are expected to remain stabilizing forces for Vornado.
The company recently reduced its dividend to an annual rate of $1.50 per share from $2.12 in 2022. The reduction was not a surprise as it was telegraphed well in advance. It results in a current yield of 6.7%. Using FFO estimates for 2023, the payout ratio is now quite moderate at 55%.
While sector risks remain elevated, Vornado’s share price fully reflects this reality. This is evidenced by Vornado’s FFO yield being over 12%, which is highly unusual for top quality real estate, as is its -48% valuation discount to the sector. The -34% to -59% discount to the book value calculations above is unequivocally pricing in material negative developments in relation to consensus estimates through 2025.
Technicals
The technical backdrop mirrors the fundamental conditions discussed above, which is on display in the 20-year monthly chart below. Note that the green line is a key support level dating back to the 2008 real estate crash. The orange lines represent the primary resistance levels, which have been carved out following the COVID collapse.
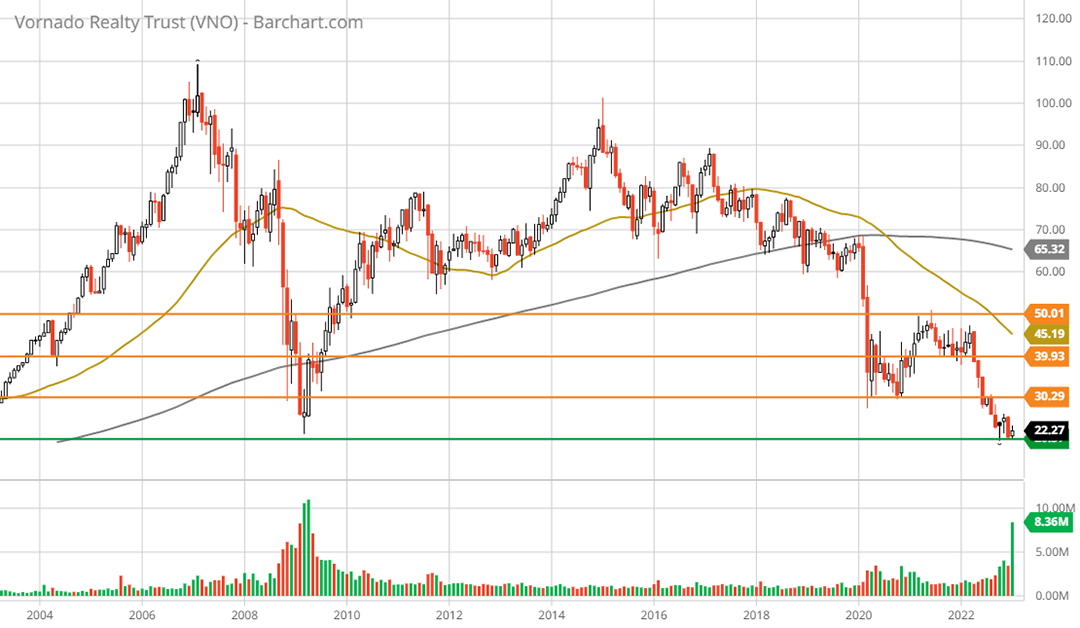
Vornado Realty Trust 20-year monthly chart. Created by Brian Kapp using a chart from Barchart.com
On each of the charts herein, the gold line is the 50-period moving average and the grey line is the 200-period moving average. Vornado’s extreme oversold condition is evident when viewed in relation to the moving averages. The 200-month moving average is +192% higher near $65, while the 50-month moving average is +102% higher near $45. The following 5-year weekly chart provides a closer look at the technical setup and the key support and resistance levels.

Vornado Realty Trust 5-year weekly chart. Created by Brian Kapp using a chart from Barchart.com
The technical upside targets are roughly $30, $40, and $50 (the orange lines), which represents upside potential of +35%, +80%, and +125%, respectively. If Vornado achieves the 2023 consensus FFO estimate and trades at the median sector valuation, the shares will trade near the $40 target. Using the consensus 2025 FFO estimate and applying the 14x median valuation, would support a move to the upper technical target near $50.
As the shares are sitting on top of the lowest support level, the technical risk/reward is decidedly skewed to the upside. Importantly, notice in the above chart that Vornado is putting in a potential double bottom at the key support level. The following 1-year daily chart zooms in on the potential bottom formation.
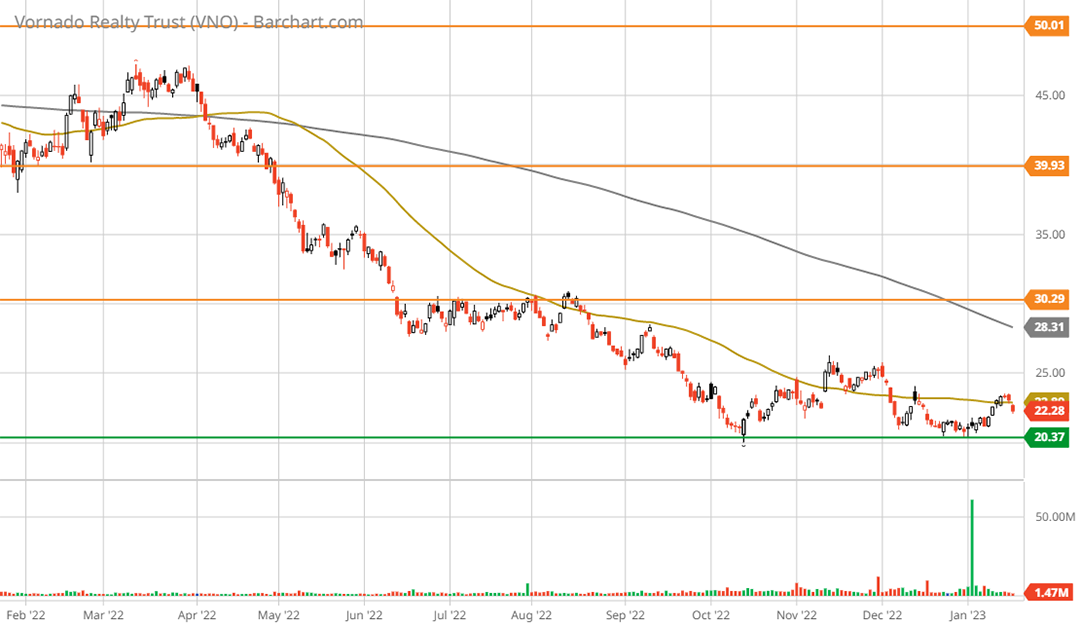
Vornado Realty Trust 1-year daily chart. Created by Brian Kapp using a chart from Barchart.com
The first bottom occurred on October 13, 2022. Technically speaking, the October bottom featured a bullish engulfing pattern. A successful retest of the bottom at the start of the year featured a volume surge, which is also quite bullish from a technical perspective.
Summary
Location, location, and location. Deeply discounted prices in Vornado’s neighborhood present a truly unique asset opportunity. The -34% to -59% discount has priced in the likely worst-case scenario, leaving a highly skewed risk/reward asymmetry. While the portfolio concentration in the Big Apple creates above-average risk, it also amplifies the upside potential while placing a foundation on the downside.
Price as of this report: $22.25
Vornado Realty Trust Investor Relations