I am assigning Aspen Aerogels (NYSE: ASPN) a positive risk/reward rating based on its incredible growth potential, an exceptionally low valuation, its competitive IP moat, and its strong support from a top-tier, long-term strategic investor. Aspen Aerogels is a top choice for high-risk, high-reward investors seeking hypergrowth opportunities. Of note, the company is scheduled to report earnings April 28, 2022, before the market opens.
Risk/Reward Rating: Positive
Aspen Aerogels is on the cusp of the greatest growth opportunity in the company’s history, the electrification of transportation and energy. The initial growth driver will be electric vehicles and the mitigation of fire risk that is introduced by EV battery technology.
More specifically, Aspen’s PyroThin™ thermal barriers address thermal runaway, which is a uniquely life-threatening risk associated with battery electric vehicles and battery technology more generally. The following news report from Texas, Austin Fire battles battery fire after Tesla crash | FOX 7 Austin Aug 12, 2021, covers two recent examples of the extreme EV safety risks which Aspen Aerogels mitigates.
From a consumer perspective, the risk of being trapped in an intense battery fire is likely to dampen demand for EVs which do not employ the highest quality and most effective safety materials. This is the competitive advantage offered to automotive manufacturers when partnering with Aspen Aerogels on their EV battery designs. Mitigating the risk of death by fire resulting from routine traffic accidents or even a house fire is likely to be a sustainable competitive advantage for Aspen Aerogels and its EV OEM partners.
Aspen’s long-standing Chief Technology Officer, George Gould, places the competitive positioning in the proper context in the following quote from Aerogels Insulate Against Extreme Temperatures, originally published by NASA in 2010.
If you can meet NASA’s high expectations for performance and safety requirements, and subsequently make a product that has commercial potential, you are on a great path to delivering goods that are the best in class.
In fact, Aspen Aerogels developed its technology working with NASA on space applications since the early 1990s. It now has a portfolio of 166 patents and 191 pending patents which serve as a moat in the aerogel marketplace. Aspen actively enforces its patents as can be seen in its most recent case against an Italian building materials firm utilizing Chinese-made aerogels.
Koch Strategic Platforms
Combining Aspen Aerogels’ best in class technology with the investment capabilities of a top tier, deeply connected investment firm such as Koch Investments Group, creates an intriguing opportunity. Koch offers access to a deep capital pool in addition to extensive industrial and supply chain connections and capabilities. It is the combination of capital and know-how that makes the Koch partnership so powerful. Aspen’s President and CEO, Donald R. Young, summarized the situation perfectly in the press release announcing Koch Strategic Platforms’ most recent investment:
KSP has been a highly valued partner over the past year, providing not only financial support but broader corporate resources. They have been invaluable to Aspen as we scale our operations and organization to keep pace with the rapidly growing demand for our aerogel products.
Jeremy Bezdek, managing director of KSP, offered Koch’s rationale for the Aspen Aerogels investment in the same press release.
KSP is attracted to strong management teams, innovative technologies and significant growth opportunities. We proactively invest in growth companies where transformation is accelerating and bringing mutual benefit through Koch’s diverse knowledge and capabilities.
The following table summarizes Koch’s investment activity to date. I have highlighted the important price discovery information. This information is important because these were private placements negotiated between two highly informed and qualified parties. Furthermore, Koch likely had the upper hand in the negotiations given its financial strength in relation to Aspen’s historically tenuous financial position. The prices paid by Koch offer an excellent reference point as to fair value, as Koch is likely seeking well above-average return potential from their Aspen investment.
Created by Brian Kapp, stoxdox
Koch paid $27.90 per share in February 2022. The shares are currently trading near $23 and closing in on the initial Koch purchase price of $21.66. With a cost basis of $23.79 per share, public investors are being offered an opportunity to invest at a lower price than Koch. This type of pricing inversion, in which public investors can buy at lower prices than industry insiders, is generally rare and points toward the possibility of outsized return potential.
An additional price signal is offered by the convertible bond investment by Koch. The price at which the bonds can be converted to stock is $34.94 per share, or 52% above the current price. While the convertible bond offers Koch added optionality, it is highly likely that the investment decision was made based on the assumption that the bonds will be converted into equity in the future. In other words, I would read the convertible bond investment decision as Koch viewing $34.94 as a substantially discounted price.
Growth
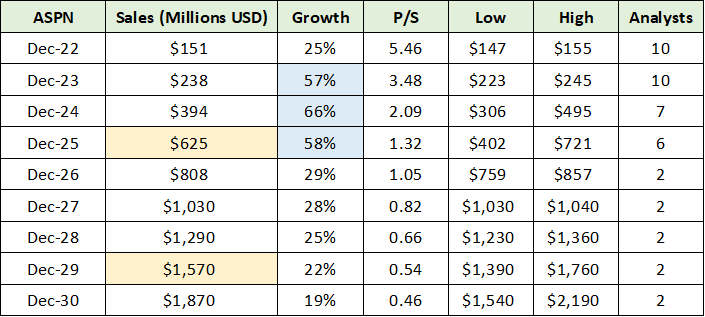
In fact, Aspen Aerogels offers a growth profile that places it in the upper echelon of the growth stock universe. The following table was compiled from Seeking Alpha and displays consensus sales growth estimates for Aspen through the end of the decade. Of note, Aspen is projected to grow its sales by 48% annualized from 2022 to 2027.
Source: Seeking Alpha. Created by Brian Kapp, stoxdox
I have highlighted in blue the most exceptional growth years in the forecast period. This is important because sales growth is the top priority for hypergrowth investors; earnings growth follows sales growth. Aspen will be entering its highest expected multiyear sales growth period in 2023. As a result, the company is entering the most attractive growth phase from the perspective of those seeking hypergrowth opportunities.
Interestingly, management has guided to $720 million of sales in 2025 compared to the $625 million consensus estimate (highlighted in yellow). The discrepancy suggests there may be upside surprise potential in comparison to consensus estimates. In the following table, I adjust 2025 and 2027 for an upside surprise scenario. 2025 is adjusted to management’s guidance and 2027 reflects the maximum annual sales potential after the completion of Aspen’s current growth plan. If these sales numbers were to be achieved, the five-year growth profile becomes extraordinary (highlighted in blue).
Created by Brian Kapp, stoxdox
Growth Plan
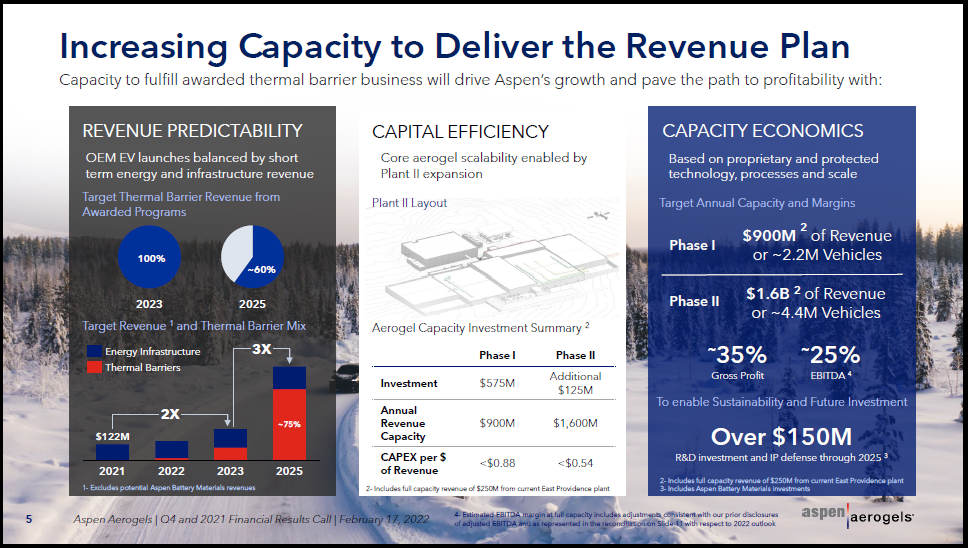
Importantly, Aspen’s growth plan is to be in a position to produce $900 million of revenue annually by the end of 2023, from a capacity standpoint. Aspen refers to this as Phase I. To reach $1.6 billion of annual revenue capacity, Aspen would require an additional 15 months to complete the necessary expansion, which translates into late 2024 at the earliest (Phase II). This is the growth plan that Koch has been funding. The following table and slide from the Q4 2021 Earnings Call Presentation summarize the growth plan.
Source: Q4 2021 Earnings Call Presentation. Created by Brian Kapp, stoxdox
Source: Q4 2021 Earnings Call Presentation
Full capacity for the growth plan is the ability to supply the manufacture of 4.4 million vehicles per year. Aspen currently works with ten global automotive OEMs and is supplying commercial amounts of its PyroThin™ thermal barriers to two of the largest in the world: General Motors (NYSE: GM) and Toyota Motor (NYSE: TM). Aspen is most deeply integrated into GM’s Ultium battery platform.
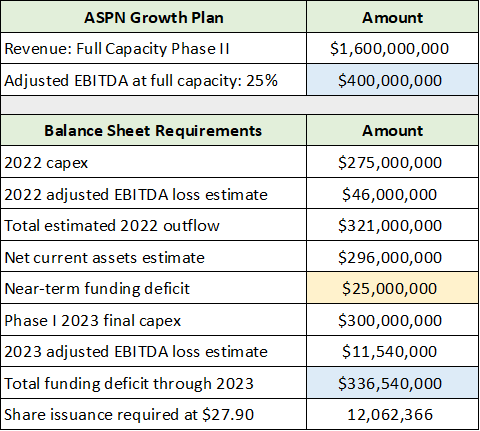
The following table displays the annual sales and EBITDA that are expected if Aspen operates at full capacity following the current investment plan. The lower portion of the table summarizes the balance sheet situation and the remaining capital raise requirements needed to execute the full plan. The data was compiled from the Q4 2021 Earnings Call Presentation and Aspen’s 2021 10-K and Q4 2021 8-K filed with the SEC.
Created by Brian Kapp, stoxdox
Aspen looks likely to require a historically large investment commitment in the $336 million range (highlighted in blue) for the completion of the full growth plan (assuming phase II can be funded internally). This capital could be raised in a variety of ways including the sale of stock (roughly 12 million shares) or more likely, convertible bonds with the same dilution effect. The expected $400 million of annual EBITDA, with marginal maintenance capex requirements, could service pure debt capital in the range of that required to complete the entire $700 million growth plan. This potential future debt capital capacity could be used to fund the next stage of growth when the opportunity presents itself.
Upside Potential
The growth profile and key investor support call for an estimation of the upside potential for Aspen. This is best achieved by ignoring future growth opportunities and assuming the current growth plan is successfully executed (full capacity at around 4.4 million vehicles per year). To do this, I compiled a list of comparable companies and sector data from Seeking Alpha. Aspen is in the materials sector and in the specialty chemicals industry (sub-sector).
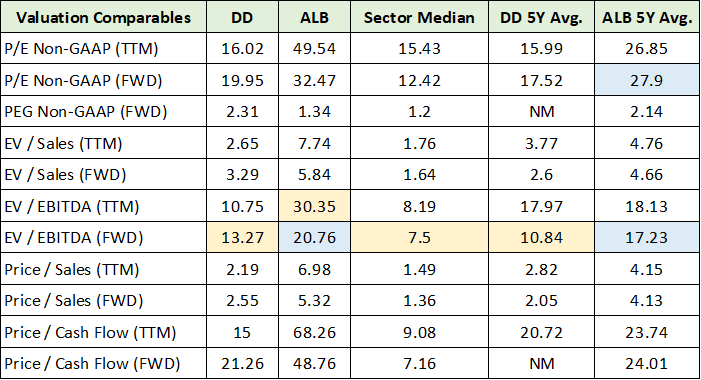
The two comparable companies are DuPont (NYSE: DD) and Albemarle (NYSE: ALB). Aspen is participating in the same general growth opportunity as Albemarle, while offering the type of product innovation and technology leadership that DuPont is known for delivering. While DuPont and Albemarle are much larger than Aspen, their EBITDA margins are in Aspen’s expected range of 25%, while offering materially lower growth potential. Each company offers a realistic valuation range for Aspen as its growth plans unfold. I have highlighted the comparable valuation statistics used to estimate Aspen’s upside potential in the following table.
Source: Seeking Alpha. Created by Brian Kapp, stoxdox
I chose to use Enterprise Value to EBITDA across a broad spectrum of comparables as it is the best measure for Aspen. I have highlighted in blue what I view as high probability valuation multiples for Aspen if it successfully executes its plan. The current 20x for Albemarle appears to be rather conservative for Aspen given its growth profile. The following table displays the upside return potential to each of the comparable valuation multiples based on Aspen’s estimate of $400 million of annual EBITDA at full capacity.
Created by Brian Kapp, stoxdox
I have highlighted in yellow what I view as the most likely range for Aspen’s upside potential. While 30x EV/EBITDA is exceptionally high, a tenbagger is certainly within the realm of possibilities. This is especially the case when considering the recent Albemarle valuation and the distinct possibility that Aspen has a rather long growth runway beyond the current expansion plan.
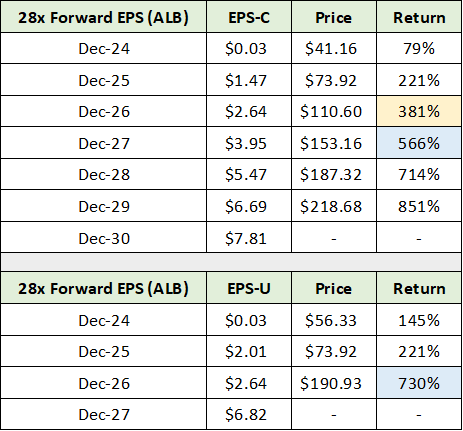
On the earnings estimate front, I chose to look at the return potential if Aspen trades at Albemarle’s current forward PE of 28x. I applied this to consensus estimates for Aspen, compiled from Seeking Alpha, in the upper portion of the table below. In the lower portion I adjust the earnings estimates for the upside sales surprise scenario discussed above. I have highlighted in blue my estimate of high probability upside scenarios if Aspen’s plans unfold roughly as expected.
Created by Brian Kapp, stoxdox
Across valuation metrics, Aspen has a potential upside return spectrum of 381% to 1,034%. The upside return range of 566% to 730% looks to be a high probability outcome if things go generally as planned for Aspen. The time frame for this return spectrum is in the range of 2026 to 2029, assuming no speculative fervor overtakes the shares in the nearer term. This is a distinct possibility as evidenced by Aspen tripling recently in just a five-month period.
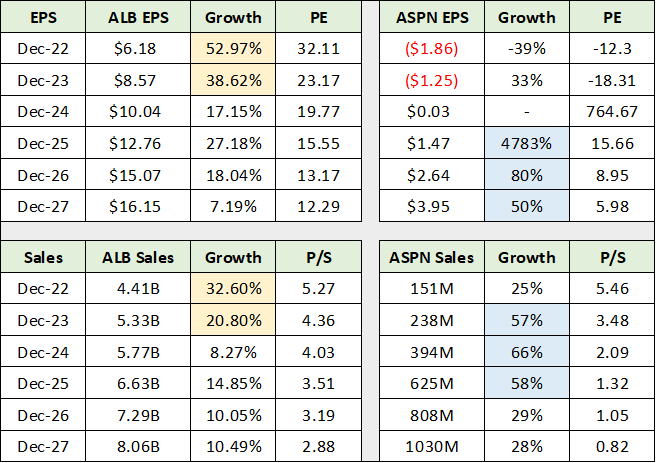
To place the use of Albemarle as a comparable in context, the following table compares the consensus growth rate and valuation for Albemarle to that of Aspen. The table was compiled from Seeking Alpha and displays consensus estimates for earnings (upper section) and sales (lower section) for both Albemarle and Aspen. I have highlighted the critical years for comparison to align the stage of growth for each company. Aspen is highlighted in blue while Albemarle is highlighted in yellow for ease of contrast.
Source: Seeking Alpha. Created by Brian Kapp, stoxdox
Given the extreme growth rate differential between the companies during similar growth phases, one would expect Aspen to trade at a substantial premium to Albemarle’s current valuation. As a result, I view using Albemarle’s current and historical valuation as a realistic estimation for the valuation potential of Aspen.
Technicals
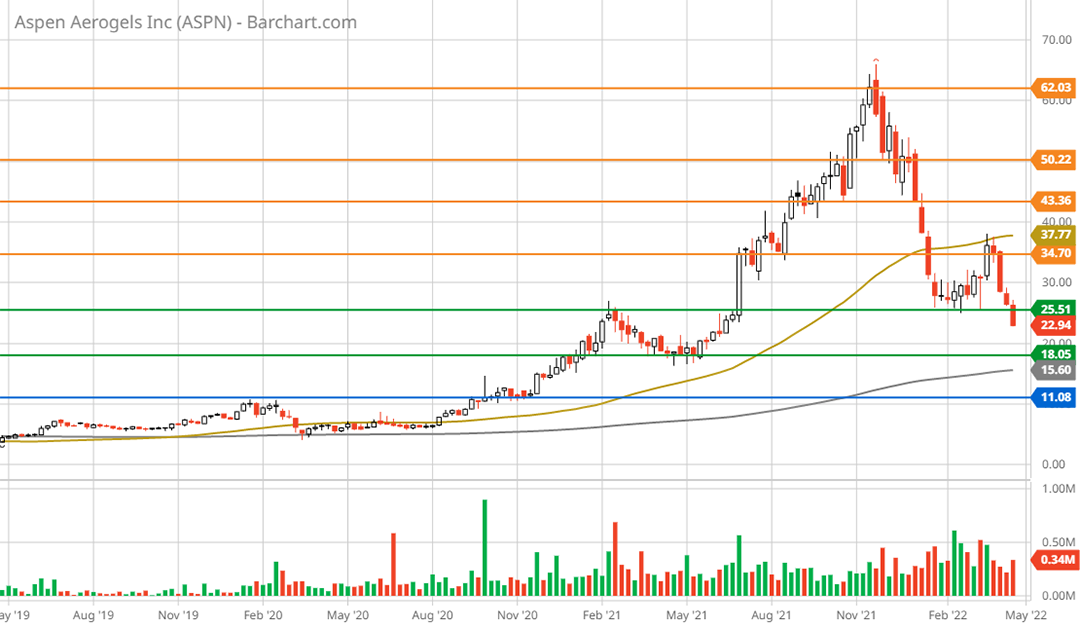
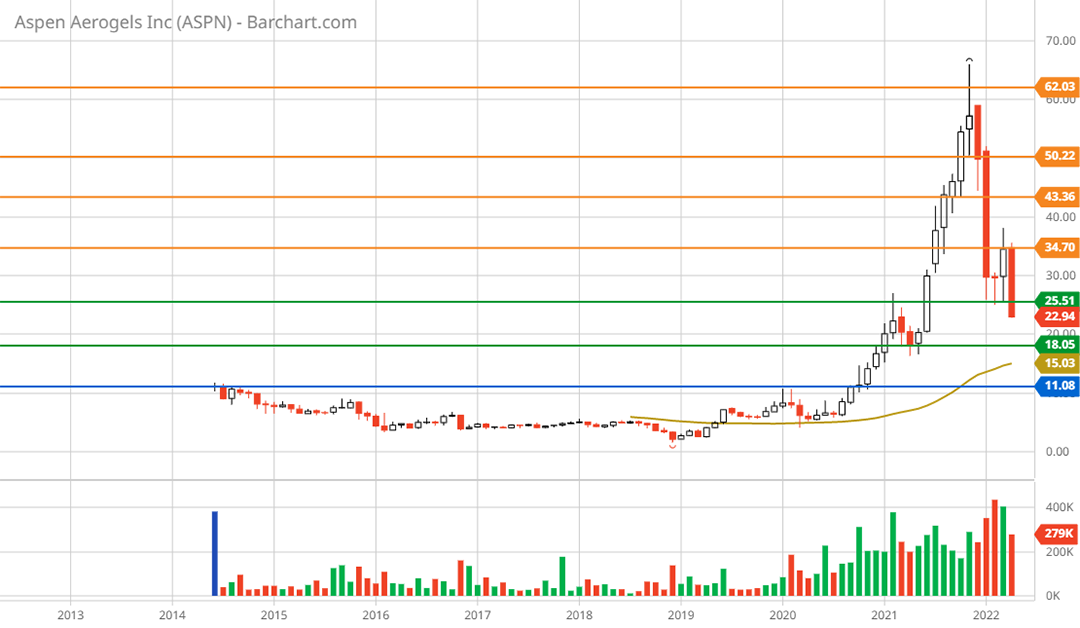
Aspen’s downside potential is best defined by the technical backdrop given its early stage of growth. The 3-year weekly chart below captures the essence of the situation quite well. I have denoted key support levels with the green and blue lines and resistance levels with the orange lines.
Aspen Aerogels 3-year weekly chart. Created by Brian Kapp using a chart from Barchart.com
Note that Aspen has taken a round trip after tripling in price following the announcement of the initial Koch investment in June 2021. The shares are now testing what should be an exceptionally strong support zone from $18 to $25. The downside potential to $18 is -22%. I view this as the most likely downside potential given the growth profile and key investor support.
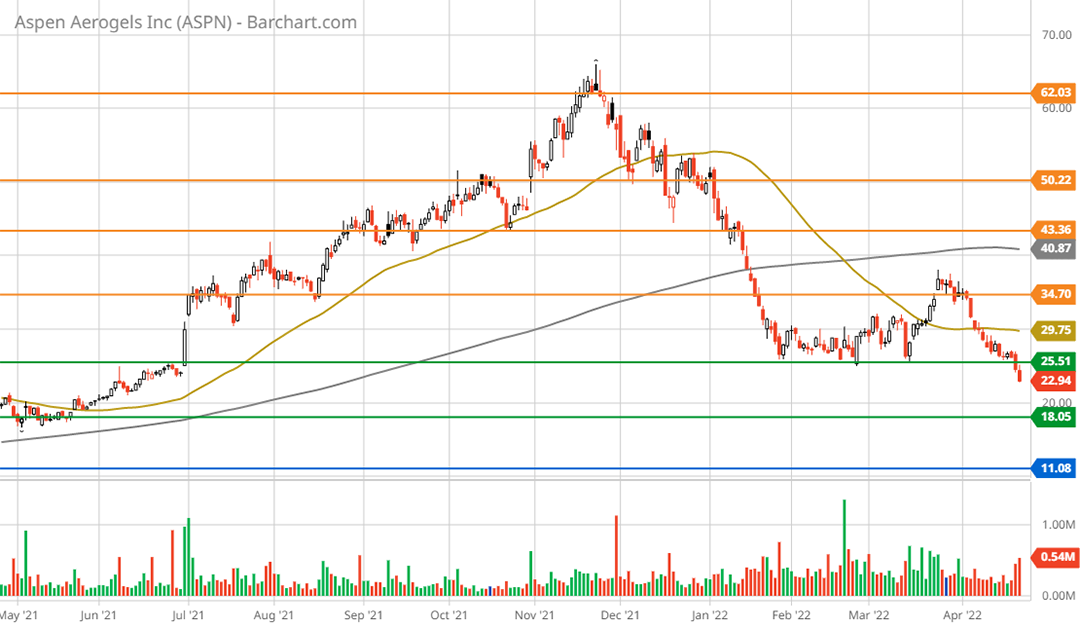
The $11 level represents the IPO price from 2014 and the primary resistance level prior to the start of the recent uptrend. This looks to be a worst-case scenario as things stand and would represent -52% downside potential. Please note that a test of this lower level would likely require a major setback in the growth plan or on the funding front. The following 1-year daily chart provides a closer look at the price in relation to the key levels.
Aspen Aerogels 1-year daily chart. Created by Brian Kapp using a chart from Barchart.com
The upside resistance levels denoted by the orange lines represent shorter-term technical upside potential. The return potential to each level is as follows: 52%, 87%, 117%, and 170%. Within the framework of the upside return estimates constructed using valuations above, these technical levels represent excellent upside return targets over the short-term (one to two years). The monthly chart below provides a bird’s eye view for greater context.
Aspen Aerogels 10-year monthly chart. Created by Brian Kapp using a chart from Barchart.com
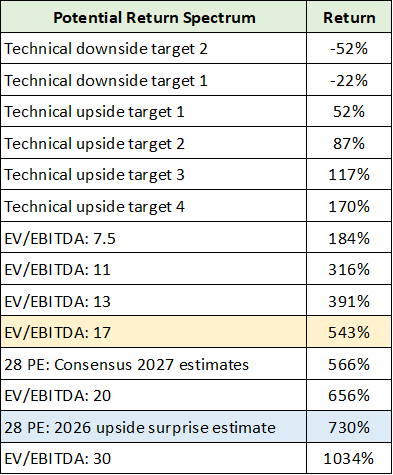
Potential Return Spectrum
The following table provides a summary of the full potential return spectrum from low to high. Over the short-term, the positive returns up to 200% look to be realistic. Looking out past mid-decade, the blue highlighted cell represents a realistic high-end expectation while the yellow highlighted cell represents a reasonable lower-end expectation, assuming the growth plan remains roughly on track.
Created by Brian Kapp, stoxdox
Risks
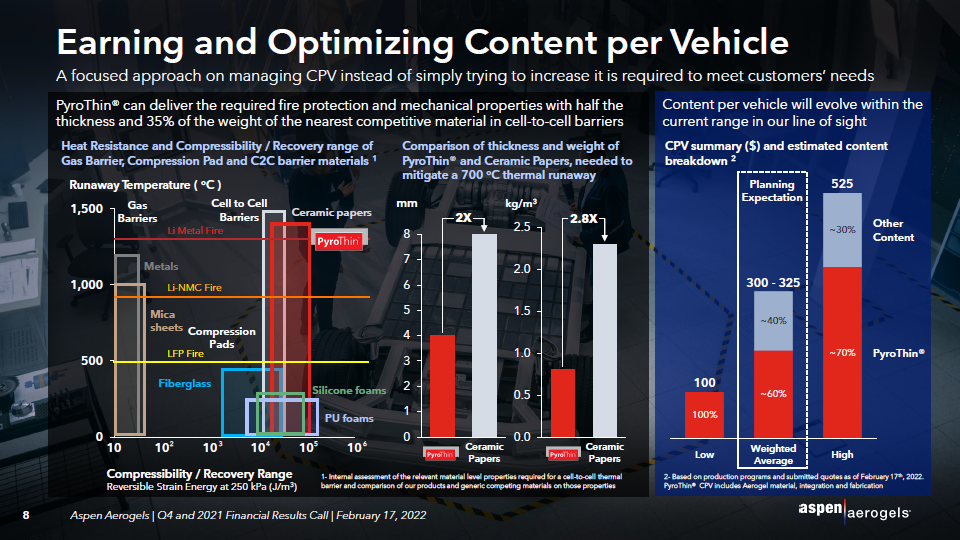
The primary risk for the Aspen investment case is that market demand does not materialize in line with Aspen’s growth plan. This is best illustrated on the following slide from the Q4 2021 Earnings Call Presentation. The key data is in the right-hand side box. The middle and left-hand side display competitive advantages in the marketplace.
Aspen is estimating roughly $300 spent per vehicle on its products and services. The range surrounding this base case is quite large, between $100 and $525 per vehicle, which signals a heightened level of uncertainty.
Source: Q4 2021 Earnings Call Presentation
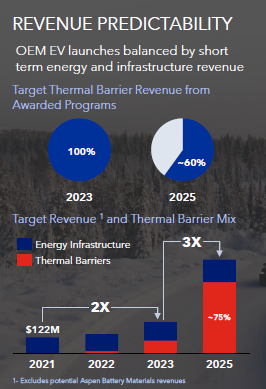
Additionally, note that traditional energy infrastructure markets account for essentially all of Aspen’s historical sales ($122 million in 2021). This market is projected to enter a cyclical upswing and grow in the 10-12% range over the coming years, which should provide an added boost.
Summary
Aspen’s visibility through 2025 combined with the Koch vote of confidence suggests that the risks are being effectively managed. Additionally, all signs point toward Aspen successfully executing on one of the more exciting growth opportunities available in the market. Aspen’s incredibly asymmetric potential return profile of -52% to +1,034% places the company in the top echelon of hypergrowth opportunities creating a leading candidate for the next tenbagger.
Price as of this report: $23
Aspen Aerogels Investor Relations Website: Aspen Aerogels Investor Relations


