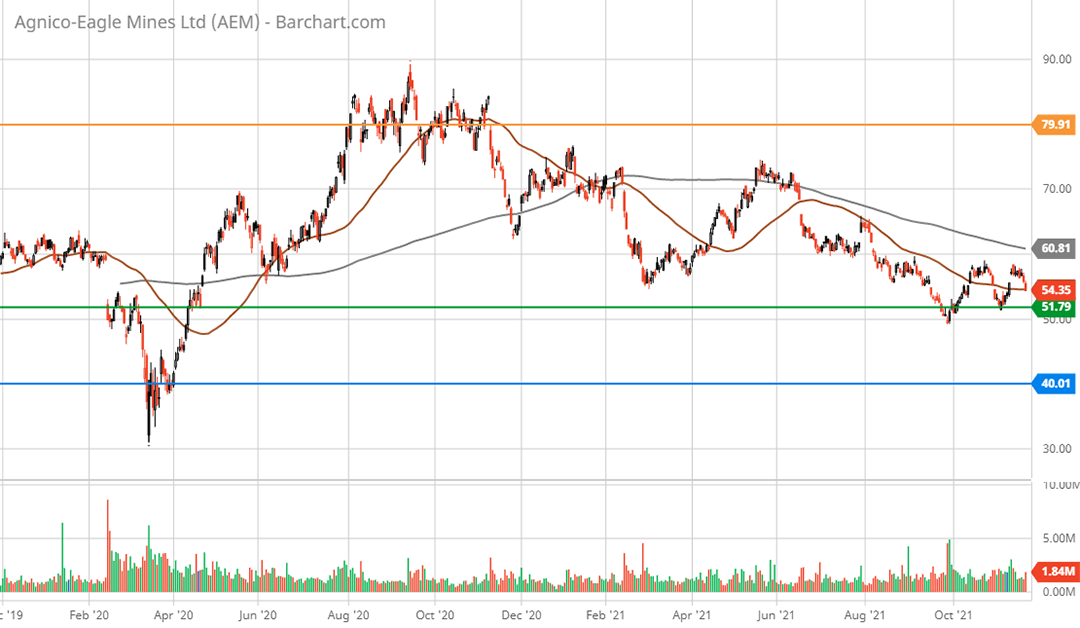
I am assigning Agnico Eagle Mines Ltd. (NYSE:AEM) a positive risk/reward rating. The positive rating is anchored by Agnico Eagle’s history of disciplined investment, its premium mine portfolio, and the planned merger with Kirkland Lake Gold (NYSE:KL).
Risk/Reward Rating Positive
The merger with Kirkland Lake Gold is a transformational moment for Agnico Eagle. Kirkland Lake adds three world-class mines with top-tier economics. Two of the mines are in Canada and one is in Australia, which are two of the most attractive mining jurisdictions in the world. The proximity of the two Canadian mines to Agnico Eagle’s existing infrastructure creates a $2 billion opportunity from operational leverage alone over the coming decade.
On the growth front, Kirkland Lake brings one of the most successful exploration and growth track records in the gold industry over the past decade. The combination creates the third largest global gold producer with a leading growth profile amongst its blue-chip mining peers.
The New Agnico Eagle
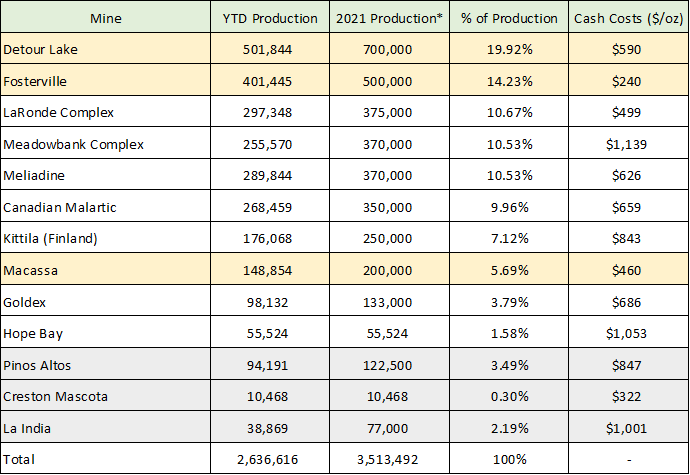
The combined portfolio of Agnico Eagle and Kirkland Lake is arguably the highest quality portfolio in the industry. Portfolio quality here incorporates the exceptional geographic mix and the industry leading economics of the mine portfolio. The following table was compiled from Agnico Eagle’s Q3 2021 earnings release and Q3 2021 corporate presentation, and from Kirkland Lake’s Q3 2021 earnings release and Q3 2021 corporate presentation. I have combined the mines of each company to present a portfolio view upon the closing of the merger.
Source: Created by Brian Kapp, stoxdox
The yellow highlighted cells are the Kirkland Lake mines while the grey highlighted cells are Agnico Eagle’s Mexican mines, which are not material. Please note that the 2021 Production* column is the most recent guidance for 2021 or the YTD (year-to-date) production, whichever is higher. The geographical breakdown of the mine portfolio is as follows: 73% Canada, 14% Australia, 7% Finland, and 6% Mexico.
Detour Lake and Fosterville will become Agnico Eagle’s two largest mines and account for 34% of the combined company’s production. These two large mines account for 86% of Kirkland Lake’s production as a standalone company today. Given the likelihood of mine disruptions as a normal course of business in the industry, this concentration created extraordinary risk for Kirkland Lake shareholders.
Valuation
This heightened risk is on full display when comparing the valuation of Agnico Eagle and Kirkland Lake. The following table was compiled from Seeking Alpha and displays the consensus earnings estimates for Agnico Eagle and Kirkland Lake and their resulting PE ratios (price-to-earnings).
Source: Seeking Alpha. Created by Brian Kapp, stoxdox
Agnico Eagle is valued at 21x earnings compared to Kirkland Lake’s valuation of 13x earnings. Given that the two companies have similar high-quality portfolios, the 59% valuation premium assigned to Agnico Eagle largely reflects its diversification and the inherently lower single-mine risk. While the two largest mines will account for 34% of Agnico Eagle’s new production, the 17% average of the two is equal to the 17% concentration in each of Agnico Eagle’s four largest mines prior to the merger. Thus, the Kirkland Lake merger provides material diversification benefits to Agnico Eagle’s portfolio, which should provide further support for its premium valuation.
Earnings Power and Return Potential
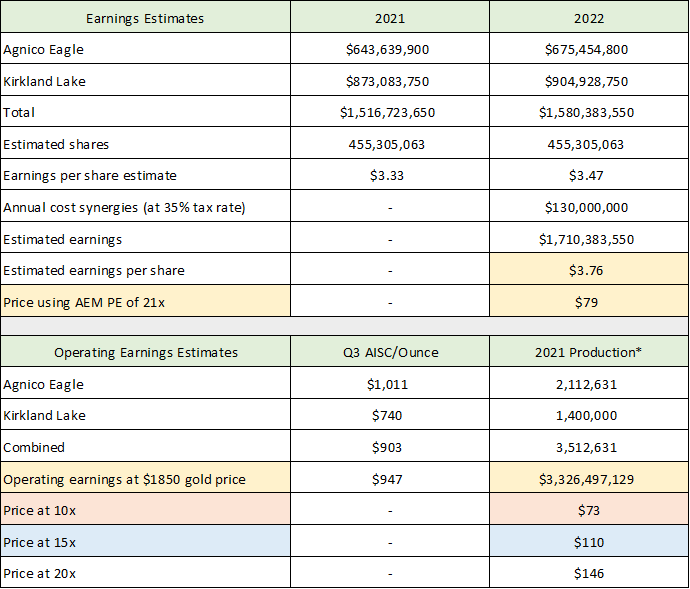
With the above earnings estimates we can begin to piece together the earnings power of the combined companies. Please note that the combined company will be Agnico Eagle Mines Ltd., with Kirkland Lake shareholders receiving 0.7935 Agnico Eagle shares for each Kirkland Lake share. The following table was compiled from the above earnings estimates, Agnico Eagle’s guidance for $2 billion of operational efficiencies over the coming decade ($200 million per year), and the estimated shares outstanding following the merger.
Source: Created by Brian Kapp, stoxdox
Based on consensus earnings estimates for each standalone company and the estimated $130 million annual cost savings after tax, the combined net earnings power exiting 2022 looks to be roughly $1.7 billion or in the $3.79 per share range (highlighted in yellow in the upper section). If the new Agnico Eagle maintains its existing valuation multiple of 21x earnings, the price per share would translate into $79. This represents a potential 45% return based solely on maintaining the current PE multiple using consensus estimates for earnings. The following table is my estimate of the immediate value creation attribution assuming the new Agnico Eagle trades to $79 per share.
Source: Created by Brian Kapp, stoxdox
Using each company’s mine guidance for 2021 and the actual Q3 2021 AISC (all in sustaining cost) reported by each company, I have estimated the combined operating margin for the new Agnico Eagle in the lower portion of the prior table. Please note that the margin estimate using AISC excludes growth-oriented expenses and general corporate expenses. It is designed to approximate the operational profitability of existing mine production before interest expense and taxes. The estimated operating earnings power of the current mine portfolio is $3.3 billion (highlighted in yellow).
In the orange and blue highlighted cells, I have provided the share price target assuming a 10x and 15x operating earnings valuation multiple. I provide the price per share at 20x as well as it is possible to reach this target under bullish conditions. I view a 10x multiple as a conservative estimate and the 15x multiple as a realistic upside target for Agnico Eagle’s shares. The return potential to each target price is 34% and 102% respectively. In these estimates I have not factored in the potential $200 million per year of cost efficiencies from the merger, which was used in the upper portion of the table to arrive at an earnings per share estimate. This exclusion provides a conservative look at the estimates.
Gold Price and Return Potential
It is important to note that the above estimates and potential price targets assume the price of gold and costs remain at the current level. The introduction of changing gold prices provides additional color for constructing an expected return spectrum looking forward. Importantly, it is Agnico Eagle’s current policy to not hedge its gold production. If this policy remains in place post-merger, shareholders will fully participate in future gold price trends. The following table uses the Q3 2021 combined AISC of $903 per ounce and estimates the potential return assuming various gold price scenarios from $1,350 to $2,500 per ounce.
Source: Created by Brian Kapp, stoxdox
I have highlighted in orange what I view as the most likely downside potential at 10x estimated operating earnings and a $1,500 gold price, which equates to -15%. A move to a $1,500 gold price would likely trigger extreme bearish sentiment placing the lower valuation multiple of 10x operating earnings in play.
If gold prices were to reach $1,350 per ounce, a sizeable portion of industry activity would recede as marginal mines and projects become unprofitable or too risky. This is highly likely to place a floor under the price of gold near $1,350. As a result, the market would likely assign a higher multiple than 10x on Agnico Eagle’s operating earnings with 15x being a realistic estimate at a $1,350 gold price. This suggests only 5% downside potential in my lowest gold price scenario, leaving the -15% at a $1,500 gold price as the most likely lower return estimate.
The yellow highlighted cells reflect my estimate of the most likely upside targets in the nearer term. I believe a 15x multiple on operating earnings is more appropriate than a 10x multiple, given Agnico Eagle’s existing and historic premium valuation multiple (21x earnings currently). In the $1,750 and $2,000 gold price scenarios, the upside return potential is 80% and 134% respectively. If the gold market experiences a shift toward strong bullish sentiment alongside a price breakout to $2,500 per ounce, the blue highlighted cells could enter the realm of possibilities.
The above gold price scenarios represent important technical levels for gold. Given the potentially large effect of a -27% to +35% change in the price of gold on Agnico Eagle’s valuation, this is a good moment to review the setup for gold. For those that read my Barrick Gold piece, much of the gold price backdrop section will be familiar.
Gold Price Backdrop
Shares of most gold miners have been in a bear market or overall sideways trend for the better part of two decades. The first decade of this trend featured an explosive bull market in the price of gold, rising over 500%. This bull market phase caused excitement in the mining industry and created an upward trend for the stocks. Caught up in the excitement, the mining companies lost their financial discipline and became overleveraged in their pursuit of growth opportunities.
When prices peaked in 2011, the mining stocks entered a brutal bear market which finally bottomed in 2015. Since 2015 the stocks have been basing sideways, unable to sustain a renewed uptrend due to the overleveraged balance sheet hangover from the prior bull market. The industry has largely eschewed growth investments since the last peak as companies focused on stabilizing their balance sheets. Currently the industry continues to favor conservatism and consolidation over risk-taking on new mine development projects.
The lack of new mine investment will continue to restrict supply as the lead time to bring new mines online is substantial. This dynamic is fundamentally bullish for the price of gold. It points toward sustained and materially higher prices being necessary in order to compensate miners for the time and price risks they must take to bring on significant new supply over the course of decades.
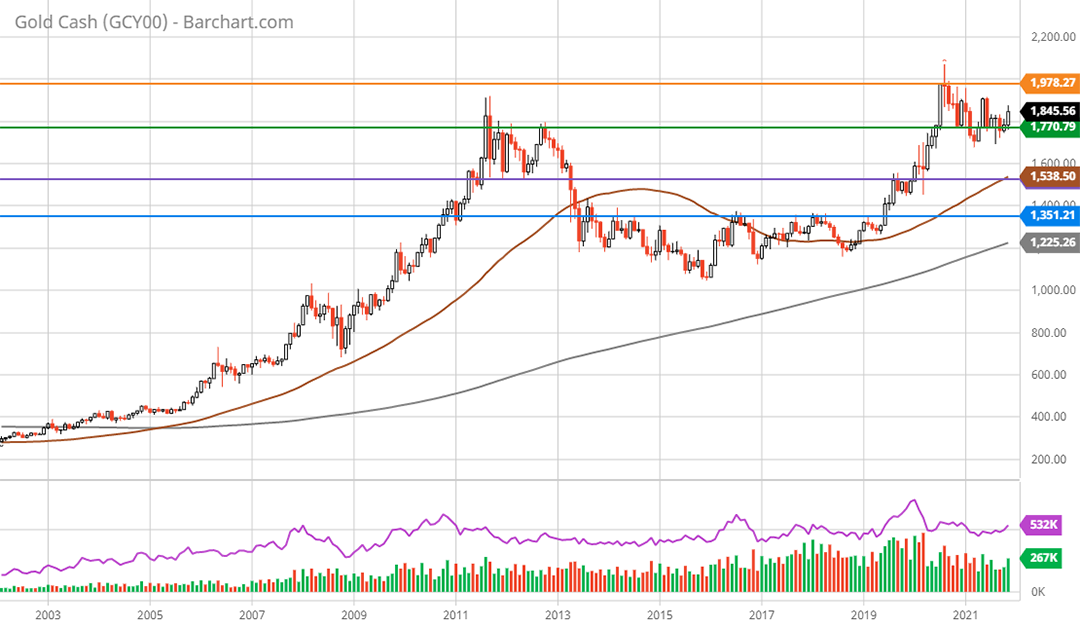
With a fundamentally bullish supply and demand balance resulting from industry conservatism, one would expect the technical setup for gold to be bullish as the market prices in the favorable dynamics. Looking at the 20-year monthly gold price chart below confirms this is the case.
Gold 20-year monthly chart. Created by Brian Kapp using a chart from Barchart.com
The price of gold has established a near perfect 10-year cup and handle pattern (as can be seen above). In fact, the price surged to a new all-time high near $2,075 per ounce in August 2020. This suggests the price of gold is building upside energy for a breakout from the 10-year sideways cup and handle pattern.
There are four well-defined support and resistance levels that have been carved out over the past decade, which are represented by the horizontal lines on the chart. All-time high monthly resistance is denoted by the orange line. A breakout above this level near $2,000 would signal a resumption of the uptrend that began in September 2018.
Trading near $1,850, the price is currently sitting just above support at $1,770 (the green line). This level represents monthly all-time high resistance from 2011 and 2012. If gold finds strong support here and breaks out to the upside, the read though would be extraordinarily bullish.
The next lower support level is at $1,526 (the purple line) which was resistance throughout 2019. It would not be surprising if a retest of this level occurs. A retest of the $1,500 area would likely serve as a wash-out event and create a potential high-energy slingshot move to the upside. This level should offer very strong support.
The worst-case scenario appears to be down to support at $1,350 (the blue line). As mentioned above, this should provide a floor because gold supply would likely shrink quickly as marginal mines and projects would become unprofitable. Furthermore, $1,350 is the level from which the current gold uptrend was established. A better view of the current primary trend is visible on the 5-year weekly chart below.
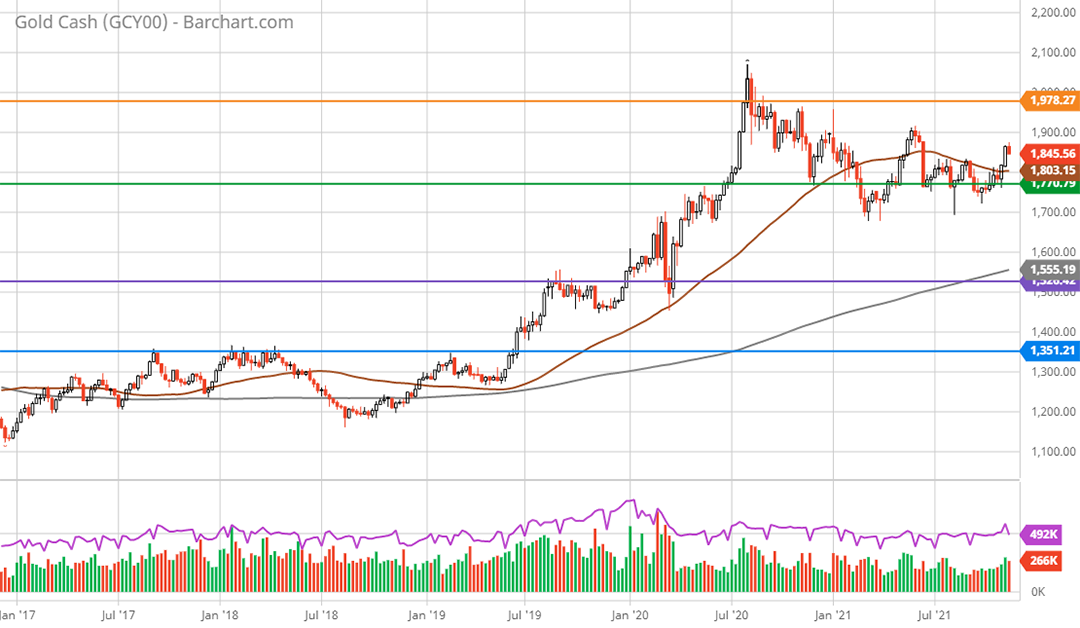
Gold 5-year weekly chart. Created by Brian Kapp using a chart from Barchart.com
As can be seen on the weekly chart the primary trend for gold is up. The current bull market became official with a break above the key level of $1,350 in June 2019. The first leg of the new bull market peaked in August 2020 at $2,075 for a 54% advance. $1,700 per ounce represents a 50% retracement of this initial bull market leg higher, while $1,575 represents a two-thirds retracement. These are common retracement amounts and lend credibility to the key support levels of $1,770 and $1,526.
Growth and Profitability Leader
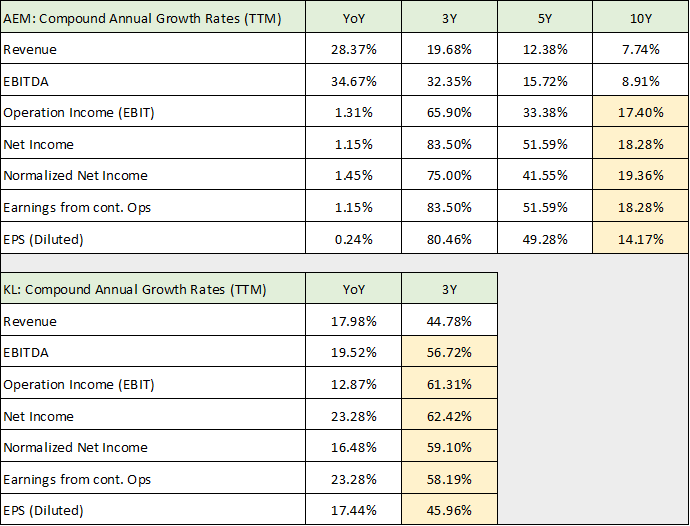
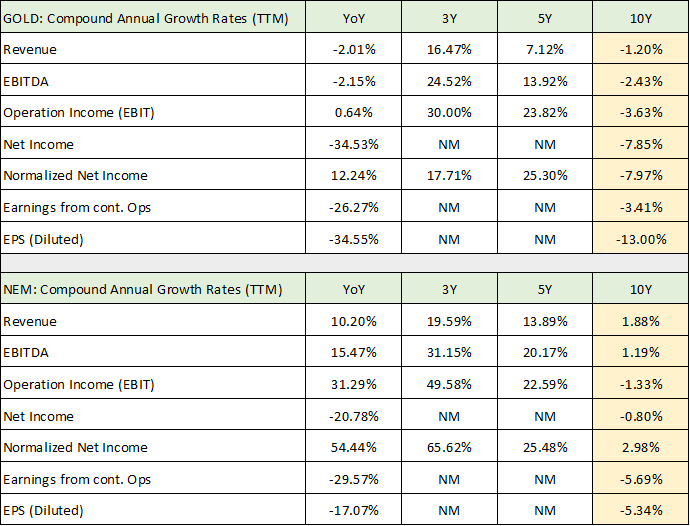
While gold has a bullish long-term fundamental and technical backdrop, the subdued investor sentiment of the moment renders a blue-chip option like Agnico Eagle attractive. As shown in the return potential section, Agnico Eagle appears to have limited downside risk in relation to the upside potential. This is largely due to it being amongst the highest quality gold miners in the world with industry-leading mine economics. The quality and profitability leadership is also supported by an impressive growth track record compared to its leading industry peers, Barrick Gold (NYSE:GOLD) and Newmont (NYSE:NEM). The following tables were compiled from Seeking Alpha and compare the historic growth rates of Agnico Eagle and Kirkland Lake to that of Barrick Gold and Newmont.
Source: Seeking Alpha. Created by Brian Kapp, stoxdox
I have highlighted the longest available performance record for each company in the table above and below. The Agnico Eagle 10-year growth rates in the high teens are extraordinary compared to Barrick Gold and Newmont, with each registering broad contraction. Given the size of the new Agnico Eagle with approximately 3.5 million ounces of annual production, I see no reason for this growth outperformance to end. With Barrick Gold forecasting 4.5 million ounces for 2021 and Newmont estimating 6 million ounces of production, the growth outperformance runway looks long indeed.
Source: Seeking Alpha. Created by Brian Kapp, stoxdox
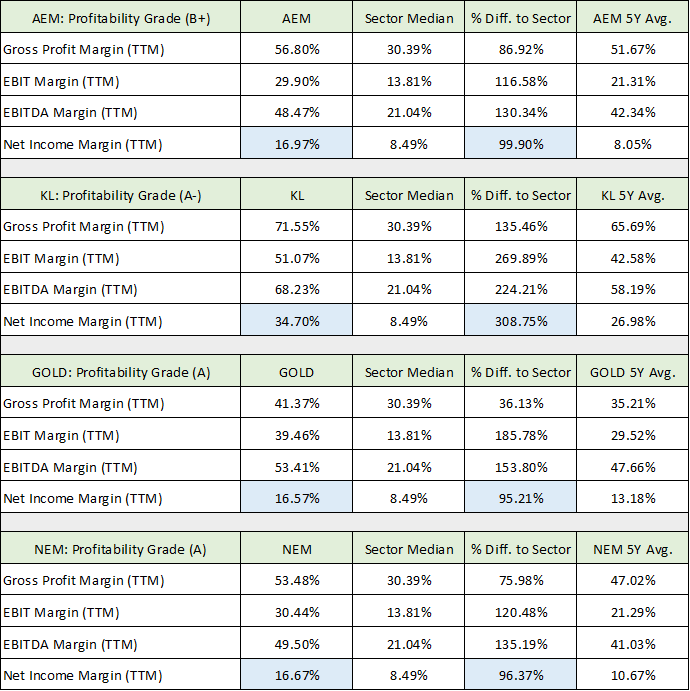
Agnico Eagle’s growth has substantially outperformed its primary peers over the past decade and this looks set to continue. Additionally, the company has accomplished this growth while producing profit margins on par with its much larger peers. The following table, compiled from Seeking Alpha, compares the profit margins of Agnico Eagle and Kirkland Lake to that of Barrick Gold and Newmont.
Source: Seeking Alpha. Created by Brian Kapp, stoxdox
I have highlighted in blue the net income margin for each company for ease of comparison. Kirkland Lake adds peer-leading profitability to Agnico Eagle’s already competitive operations. The merger places Agnico Eagle on a path to become the absolute industry leader in terms of growth and profitability. For these reasons, I believe Agnico Eagle will continue to trade at a premium valuation to the top-tier peer group.
Agnico Eagle’s valuation at 21x estimated 2021 earnings appears moderate in comparison to Barrick Gold and Newmont, which trade at 18x expected 2021 earnings. The current valuations are similar, while the historic and projected growth rates and profitability are quite distinct. The insignificance of the Agnico Eagle valuation premium in comparison to its massive growth differential suggests that Agnico Eagle is relatively undervalued compared to Barrick Gold and Newmont. For further relative upside potential, I recently highlighted Barrick Gold’s positive risk/reward rating which reinforces the investment case for Agnico Eagle.
Financial Strength
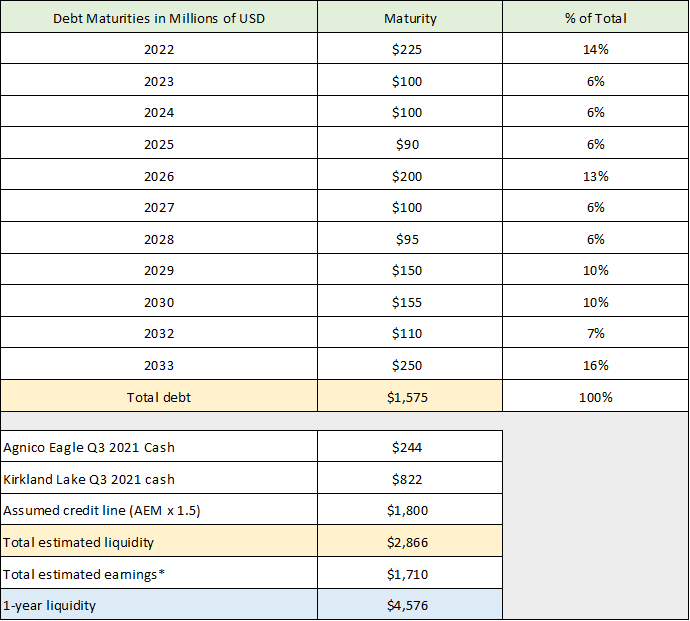
The operating and investment discipline of the Agnico Eagle team is evidenced by the impressive and consistent growth and profitability record over the past decade against the backdrop of a brutal bear market for the gold mining industry. This investment discipline is on full display when viewing the company’s use of the credit markets in its financing strategy. The following table was compiled from Agnico Eagle’s Q3 earnings presentation and shows select cash and debt details from the company’s balance sheet.
Source: Created by Brian Kapp, stoxdox
The maturities of the company’s $1.58 billion of debt are perfectly structured for stability and ease of repayment or refinancing upon maturity through 2033. Agnico Eagle’s balance sheet looks designed to maximize optionality. This optionality is on display with the transformative Kirkland Lake merger while at the same time executing Agnico Eagle’s largest ever exploration budget. I estimate that Agnico Eagle could achieve a liquidity position of $4.6 billion at the end of 2022, with cash nearing $2.7 billion. Reflecting the increasing financial strength, the ratings agencies have placed Agnico Eagle on ratings watch positive for a potential upgrade as a result of the Kirkland Lake merger.
Optionality and Growth Opportunities
With the material financial strengthening and organic earnings growth resulting from the Kirkland Lake merger, the new Agnico Eagle will be in a prime position to execute a significant growth plan in the coming decade.
Canada
With 73% of production coming from Canada and many of the most promising projects in the industry being developed in Canada, Agnico Eagle could offer an attractive exit strategy for several top-tier exploration companies. Notable examples are Great Bear Resources (OTCQX:GTBAF) and Osisko Mining (OTCPK:OBNNF).
Osisko Mining
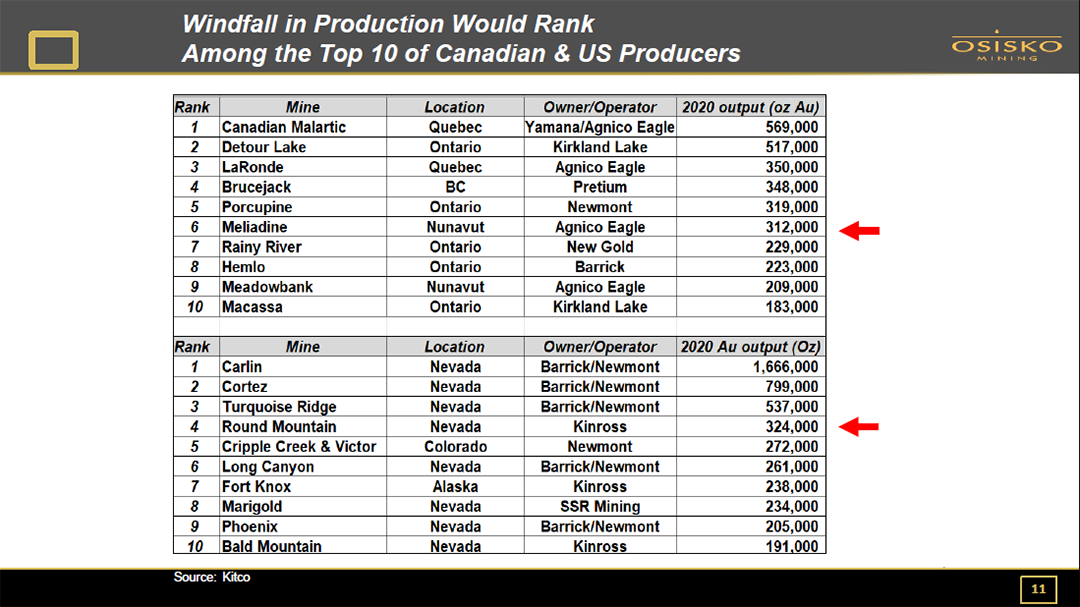
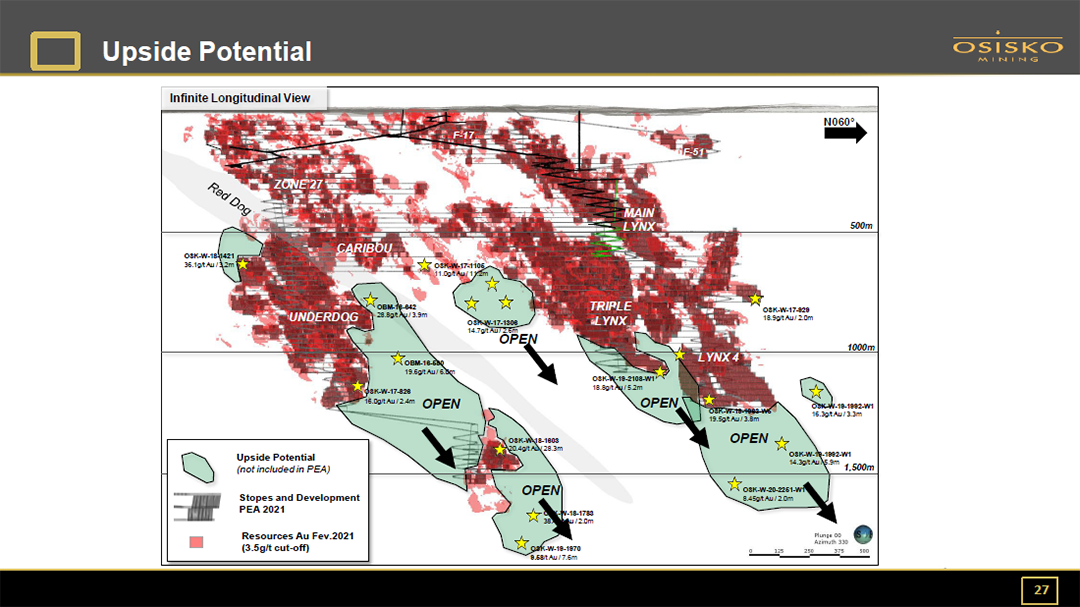
Osisko Mining’s Windfall discovery offers an initial production profile of 300,000 ounces per year of high-grade gold at 8.1 g/t. The size of the mine is in Agnico Eagle’s wheelhouse with the accompanying attractive economics of a high-grade gold mine. The following two slides provide further details on the Windfall opportunity.
Importantly, each of the Windfall gold discoveries (highlighted in red and green in the image above) remain open at depth offering the opportunity for an extended mine life with highly profitable economics. Interestingly, the Osisko team brought Agnico Eagle’s Canadian Malartic mine to fruition. This could form a bridge for the commercial development of the Windfall project.
Great Bear Resources
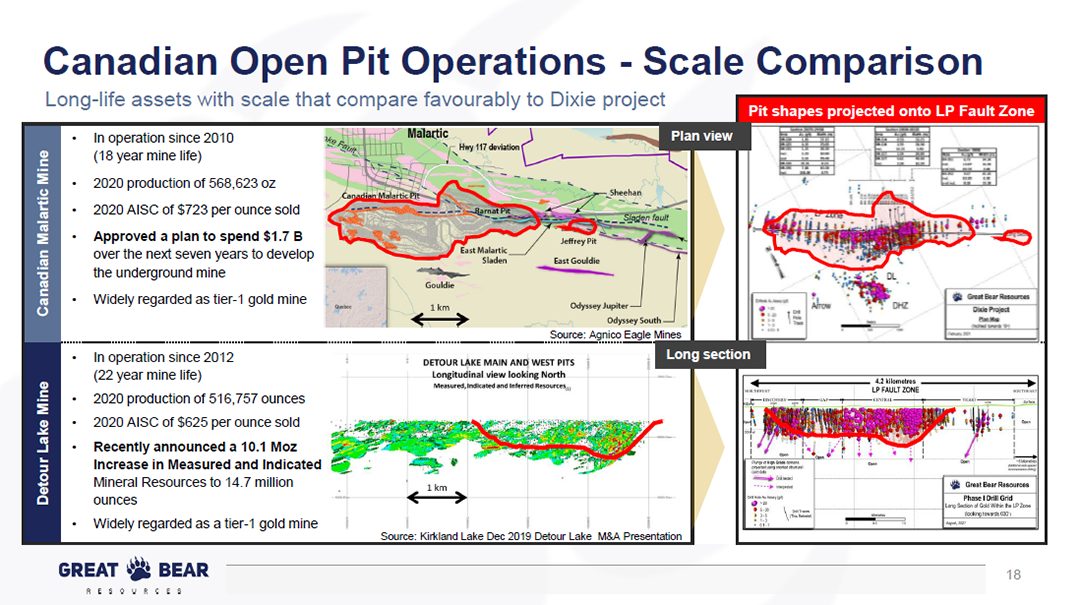
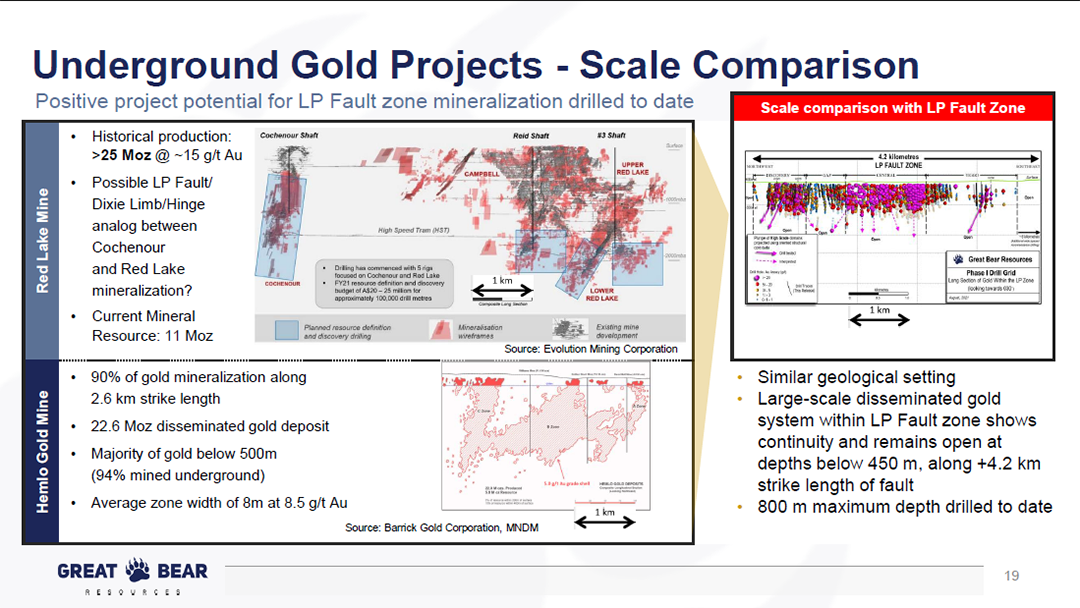
Great Bear Resources appears to take the top prospect spot with an apparent district scale discovery south of the Red Lake mining complex in Canada. The company presents several visuals to compare the size of its Dixie Project discovery to the top gold mines in Canadian history. Two of the images are provided below for a sense of the potential.
These are massive, company-changing mines being used to frame the Dixie Project potential. This resource looks to be capable of producing as a top-tier global asset. Similar to the Windfall opportunity, the Dixie Project discovery remains open to new discoveries at depth, creating the opportunity for a very long-lived mine with industry leading economics and gold production potential. Great Bear Resources and Osisko Mining are two excellent examples of the growth opportunities in front of Agnico Eagle. These two projects alone could propel significant growth looking through the end of the decade.
Finland
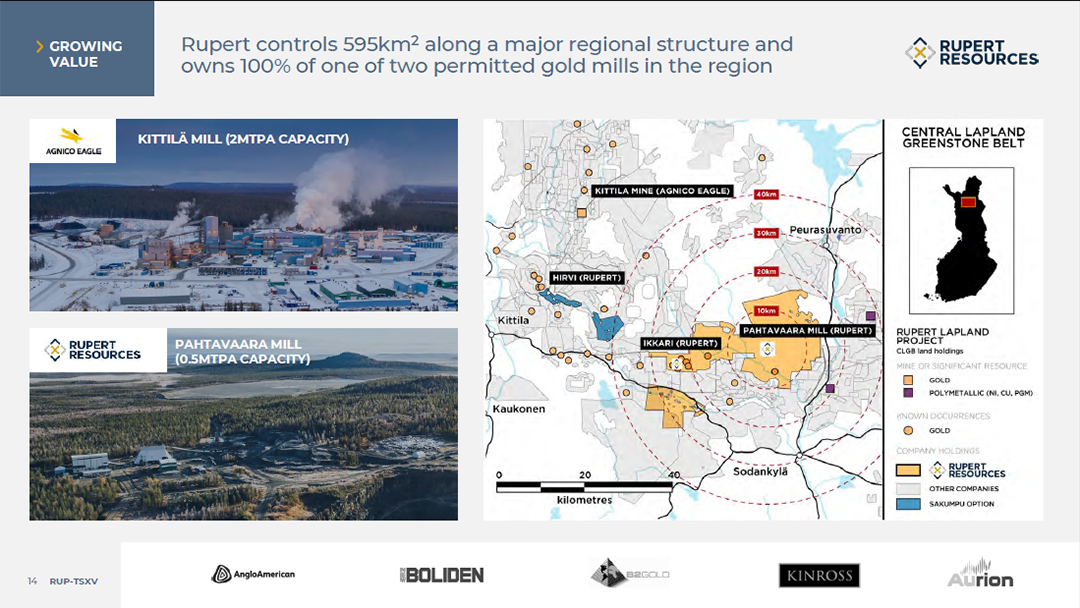
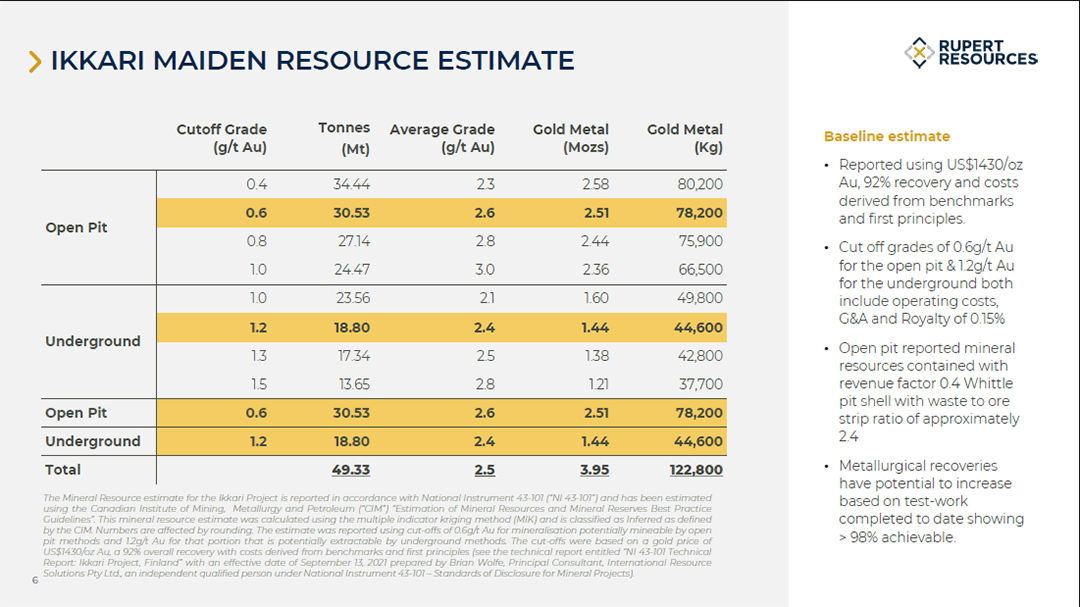
Agnico Eagle has a sizeable mine in Finland that produces great economics. The operation is expected to produce 250,000 ounces in 2021. While an attractive mining operation, greater scale would be beneficial to Agnico Eagle. In this respect, the company has an iron in the fire for future growth potential. Agnico Eagle owns 14.9% of Rupert Resources (OTCQX:RUPRF) which appears to have a meaningful discovery just south of Agnico Eagle’s Kittila mine in Finland. The discovery is near an existing mine with functional infrastructure, which enhances the economics of the opportunity. The proximity to Agnico Eagle’s existing mine in Finland and Rupert Resources maiden resource estimate are shown below.
Agnico Eagle looks to be the only large gold miner for which this opportunity would be of interest. If the discovery proves fruitful, Agnico Eagle may be able to achieve further growth and operational leverage in Finland.
The three opportunities outlined above are a small sample of what could catapult Agnico Eagle toward the position as the world’s greatest gold mining company. There are many additional growth opportunities and other great markets with potential for operational leverage such as Australia. The underlying theme on the exploration company opportunity front is that Agnico Eagle is the leading large-cap growth partner, with the highest growth potential and thus the most attractive equity currency. The future looks bright for Agnico Eagle.
Technical Backdrop
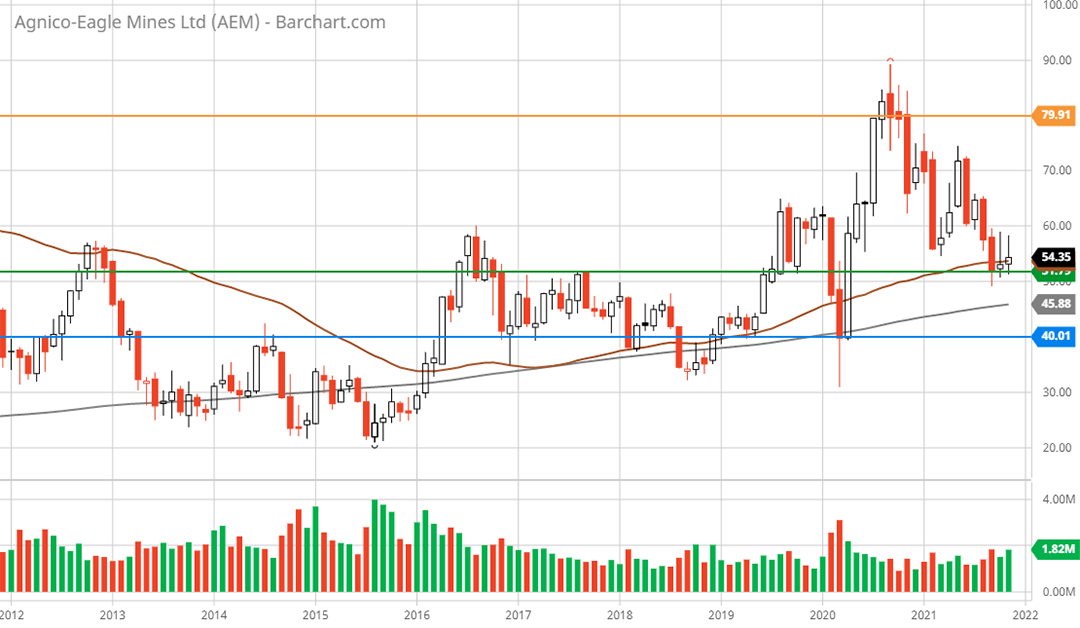
The bright future presents itself against an incredibly attractive technical backdrop from a risk/reward perspective. The following 10-year monthly chart shows that Agnico Eagle is sitting on what should be long-term support denoted by the green line.
Agnico Eagle Mines 10-year monthly chart. Created by Brian Kapp using a chart from Barchart.com
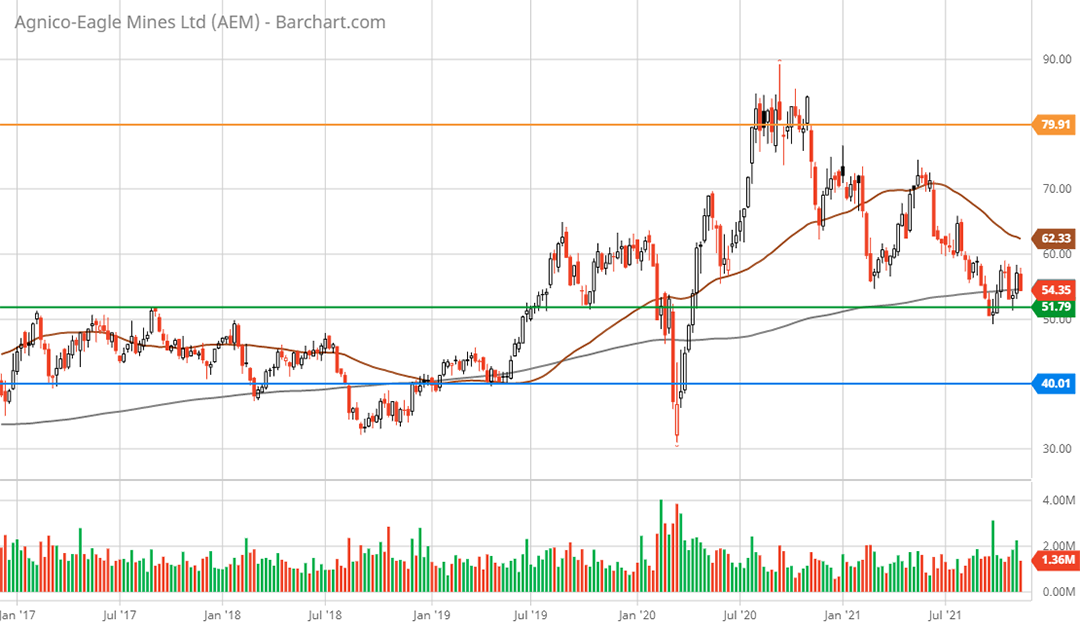
The green line represents a major monthly resistance level in 2012 and throughout 2016 and 2017. This level was finally breached in a convincing manner in 2019 alongside gold’s breakout above $1,350, with a brief retest during the March 2020 COVID crash. The technical support at this level should be strong while the attractive fundamental setup and relative valuation discount offer additional backing. Carrying the key support and resistance lines over to the 5-year weekly chart below provides a closer look and supports the view of limited downside risk in relation to the upside return potential.
Agnico Eagle Mines 5-year weekly chart. Created by Brian Kapp using a chart from Barchart.com
The green support line is clearly visible as a major resistance level from 2017 until the upside breakout in 2019. Since this period, Agnico Eagle has become a top-tier gold producer and is on a trajectory to become the world’s leading blue-chip gold miner with the Kirkland Lake merger.
In the event that this support level does not hold, next lower support is at the blue line in the $40 area. This would approach the midpoint of the worst-case valuation scenario of $34 to $46 per share from the fundamental valuation scenarios above. Should this level be tested, it is likely to be short lived as was the case during the March 2020 COVID crash. Additionally, this level was last reached during a materially more bearish gold industry backdrop than exists today. The following 2-year daily chart provides a closer look at just how close Agnico Eagle is to the primary support levels.
Agnico Eagle Mines 2-year daily chart. Created by Brian Kapp using a chart from Barchart.com
Turning to the upside potential, the first technical resistance is at all-time highs and is denoted by the orange line on the charts. This level perfectly aligns with the upside price target of $79 applying Agnico Eagles current 21x PE multiple to the estimated earnings of the combined company. Given that there is little in the way of overhead resistance before reaching the $79 area, this appears to be a high probability technical upside target. The agreement between technical and fundamental analysis on reaching the $79 target provides reason for a high degree of confidence.
If all-time high resistance (the orange line) can be overcome , the additional upside targets discussed in the fundamental analysis section will be free from technical resistance. The technical backdrop fully confirms the positively skewed risk/reward asymmetry for Agnico Eagle.
Summary
Agnico Eagle has been the clear growth and quality leader among the large-cap gold miners over the past decade. The Kirkland Lake merger will transform the company into an elite gold producer and propel the company to the position of the world’s third largest gold miner. Unlike its blue-chip peers, Agnico Eagle and Kirkland Lake offer a long growth runway with a high probability of continued and substantial outperformance. With an expected return spectrum of -15% to +240%, Agnico Eagle offers an exceedingly positive risk/reward asymmetry which is unusual for such a high-quality company. Agnico Eagle has set the stage to become the world’s greatest gold mining company.
Price as of report date 11-21-21: $54.35
Agnico Eagle Investor Relations Website: Agnico Eagle Investor Relations
Agnico Eagle SEC Filings
Kirkland Lake Gold Investor Relations Website: Kirkland Lake Gold Investor Relations
Kirkland Lake Gold SEC Filings


