Risk/Reward Rating: Negative
GameStop reported earnings this evening after the market closed sending the shares down 10%. The earnings have been eagerly anticipated as the company has become a lightning rod for the resurgence of retail trading in 2021, when the shares exploded from $10 to $480 over the course of just two weeks in January. GameStop quickly became a short squeeze and anti-establishment meme as many hedge funds and professional traders were caught offside with large short positions when the stock exploded. The stock gained further notoriety when it became the focus of congressional hearings which no doubt added to the anti-establishment allure.
While the stock did collapse from $480 to $40 in short order after the January 2021 runup, the persistence of the anti-establishment meme status of GameStop has been impressive and has propped up the share price in a volatile range around a central level of $200. The company seized the day and issued new shares into the elevated price level, breathing new life into what was widely believed to be a dead man walking business model in the beleaguered bricks and mortar retail sector.
The GameStop Foundation and Reboot Strategy
The above developments were timely for GameStop as the COVID pandemic was expediting its downward trajectory. Prior to the COVID outbreak, the downward trend of the GameStop business model was well established prompting a corporate strategy change in 2019 labeled GameStop Reboot. Ironically, the near death COVID experience for GameStop also caused the resurgence of retail trading that has provided the company fresh equity capital and a new lease on life to execute the reboot plans. The question for GameStop investors is whether it is too little too late or can the company successfully execute its turnaround within the limited budget it now has.
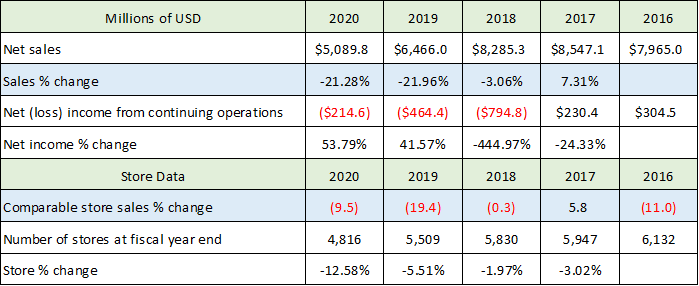
Before going into the reboot strategy and its possibilities, it will be helpful to lay the foundation on which GameStop currently stands to better understand the challenges and opportunities. In physics, it is said that a trend in motion stays in motion until acted on by an outside force. As a result, we need to understand the existing trend that is in place on which the meme force has acted. The following table is compiled from summary data in the company’s most recent 10-K annual report filed with the SEC. It is big picture information from the company’s income statement with detail on GameStop’s physical store count and performance.
I have highlighted the most important trend data in blue pertaining to sales. As can be seen in the first blue shaded row, the declining sales trend began in 2018 at -3% and materially accelerated into 2019 coming in at -22% well before the onset of COVID. With the closure of retail stores during COVID, the sales decline was actually less severe than in 2019 coming in at -21%. The second blue shaded row breaks down the same store sales data over this period. Again, the declines began in 2018 and accelerated rapidly, if less severely, than overall sales on a percentage basis. This was due to GameStop closing underperforming stores (final row).
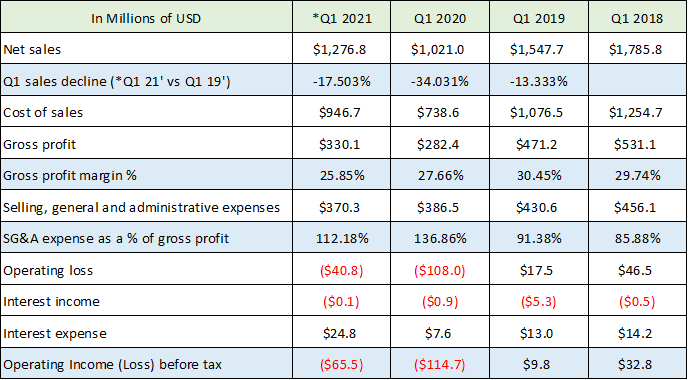
The recent meme inspired influx of capital is exerting its influence on a well-entrenched and sizeable business downtrend. Sales declined $3.5 billion or 41% from 2017 through 2020 while the store count declined over 1,300 or 21% through the same period. The trends are still in motion in the first quarter of 2021. The following table was compiled from the 10-Q quarterly report filed with the SEC for Q1 2021 (ended May 1, 2021). The Q1 2019 and 2018 data was compiled from the Q1 2019 10-Q filed with the SEC.
I have highlighted the most important data in blue. Please note that I am comparing the sales percentage change in Q1 2021 to Q1 2019 because COVID decimated sales in Q1 2020 making it a poor comparison for identifying the overall trend in place. In the most recent quarter, sales contracted 17.5% compared to Q1 2019. This points toward a continuation of the sales downtrend observed in the annual numbers in the first table, although less severe than the 21-22% experienced in the last two years. It should be noted that in this evening’s Q2 2021 earnings report, the sales decline moderated to -8% compared to Q2 2019 suggesting the possibility of a slowing downward trajectory.
In addition to the negative sales trend continuing in 2021, margins are also declining as can be seen in the next three blue shaded rows. Gross margins are down 15% in Q1 2021 compared to Q1 of 2019, which was during a period of material store closures and costs reductions. Cost trends are clearly trending materially higher in the supply chain to offset the aforementioned cost reductions. Additionally, selling, general, and administrative expenses are not declining fast enough to keep pace with the sales decline and gross margin contraction causing steep operating losses in Q1 2021 compared to Q1 2019. The downward trend is clearly continuing through 2021 to date and may be getting worse in respect to margins.
Reboot Strategy
The challenge for the reboot of GameStop going forward largely rests on the physical to digital transition theme. The industry value chain is increasingly moving from the physical to the digital realm. This transition has implications for both GameStop’s traditional brick and mortar retail model (as opposed to online) as well its historical reliance on hardware sales (as opposed to gaming software). I touched on the physical stores issue above by highlighting the reduction in physical stores during the past four years. This is set to continue under GameStop’s Reboot strategy.
Hardware
One of the overarching historical themes in the cadence of GameStop’s business has been its sales cyclicality being tied to new hardware releases. Refresh cycles from the console manufacturers have led to increased sales rates while the maturation of prior releases have resulted in reduced growth rates for GameStop. GameStop’s reliance on physical hardware sales is highlighted in the following table compiled from its most recent 10-K annual report filed with the SEC.
Please note that the % columns are the percentage of total sales that each segment contributed each year. While the 2020 vs 2018 column is the percentage decline in sales for each category in 2020 compared to 2018. The first thing to note is that hardware sales is the largest sales segment for GameStop over the past year and has been close to 50% of sales across all time frames. The challenge with this reliance on hardware is that the majority of the value creation going forward will be from software (games).
Additionally, hardware is very cyclical over many year timeframes which creates volatility for the underlying business performance. Finally, the competition for selling hardware is increasingly intense. For example, GameStop competes with the likes of Amazon, Walmart, Target, and Best Buy to name just a few who may view gaming hardware as a loss leader to drive traffic during the all important Q4 holiday season. Making matters worse, GameStop received 42% of its sales in 2020 in the fourth quarter. The hardware reliance creates acute execution risk for GameStop in terms of the hardware itself and the compressed time frame during the holidays in Q4 each year that it must execute successfully against its much larger competitors.
Software
The trends in software are not currently moving in the right direction (blue shaded row and column). The 2020 decline in software sales of 49% compared to 2018 (blue column) is incredible and points to the lack of digital presence by GameStop as other gaming sales have been robust in comparison.
Here too, there is no lack of competition from incredibly strong companies with resources at their disposal that dwarf those of GameStop. Companies such as Nintendo, Sony, Microsoft, Nvidia, and Roblox provide a sense of the competitive spectrum. In addition, new entrants are arriving daily such as Netflix’s recent announcement of its intent to compete in the online gaming space. Furthermore, many of the large software competitors are suppliers to GameStop and have an economic incentive to drive gaming traffic to their own platforms in order to maximize margins. The competitive landscape on the software side of gaming is as daunting if not more so than the hardware side of the market.
Other Reboot Risks from the 2020 10-K
GameStop outlines several risk factors in its 10-K that take on heightened importance for its reboot strategy. The company has concentrated vendor risk which takes on added weight with supply chain restrictions across the technology supply chain today. Three suppliers accounted for 62% of its new product purchases in the past year (Nintendo at 31%, Sony at 22%, and Microsoft at 9%). With supply chain restrictions in hardware, these firms may choose to allocate available product to larger distribution partners or on less beneficial terms to GameStop. On the software side, they would prefer to drive traffic to their own gaming platforms to maximize margins and cut out the middleman.
Another risk factor for GameStop’s’ successful reboot execution revolves around rapid technological advances in the types of games and entertainment software as well as their method of delivery. GameStop has lost market share in the past due to its inferior technological position in the marketplace and looks to remain at a competitive disadvantage in the future. This is the highest hurdle the company faces in successfully executing its reboot strategy. The budget required to compete technologically today likely dwarfs that available to GameStop.
The weak competitive positioning on the technological and digital delivery front creates heightened risk for the store closure strategy that is at the core of the reboot plan. As stores are closed, these customers may transition fully away from GameStop to competing online platforms. If the company can’t maintain these relationships, a self-reinforcing downtrend may prove difficult to reverse.
Finally, the turnaround plan is going to require significant capital investment which may exhaust the funds raised by selling shares into the recent share price elevation. The reboot strategy requires not only heavy technological investments but the modernization of the company’s infrastructure. For example, GameStop’s supply chain relies on five facilities globally which account for 88% of its distribution square footage. This is a concentrated geographical footprint which may limit its speed to market in serving over 4,800 stores globally as well as going direct to consumer. GameStop’s competitors have much more advanced supply chains that can react quickly to an increasingly fast changing industry and end consumer demand.
Summary and Valuation
GameStop has a daunting task in front of it in successfully executing the GameStop Reboot strategy. The declining business trends in place discussed above will require an incredible amount of strategy and execution force coupled with the freshly raised capital to reverse the trend that is now in motion. Reversing this downward trajectory against the competitive winds of the world’s technology and retail heavyweights will require near perfection from the GameStop team. GameStop has secured its survival in the near term while its long-term success remains a long shot.
For those looking to accumulate the shares, a valuation is tricky given the operating loss trend of recent years and expectations for limited profitability going forward. At the current price, GameStop is trading at 2.7x sales estimates using Q1 2021 trends compared to 2019. For a comparison, Walmart is highly profitable and successful and trades at .74x trailing 2020 sales. While not a good comparable company for GameStop, 0.74x sales or there about is not unusual for all manner of retailers in the markets. This type of valuation multiple would imply a GameStop stock price of $55. For those that believe in the turnaround story of GameStop, this level is much better supported by the fundamentals and would provide a level of compensation for the extreme risks facing the GameStop business model and reboot strategy. As we will see, the technical picture also suggests the area near $55 may offer a more attractive entry point.
Technicals
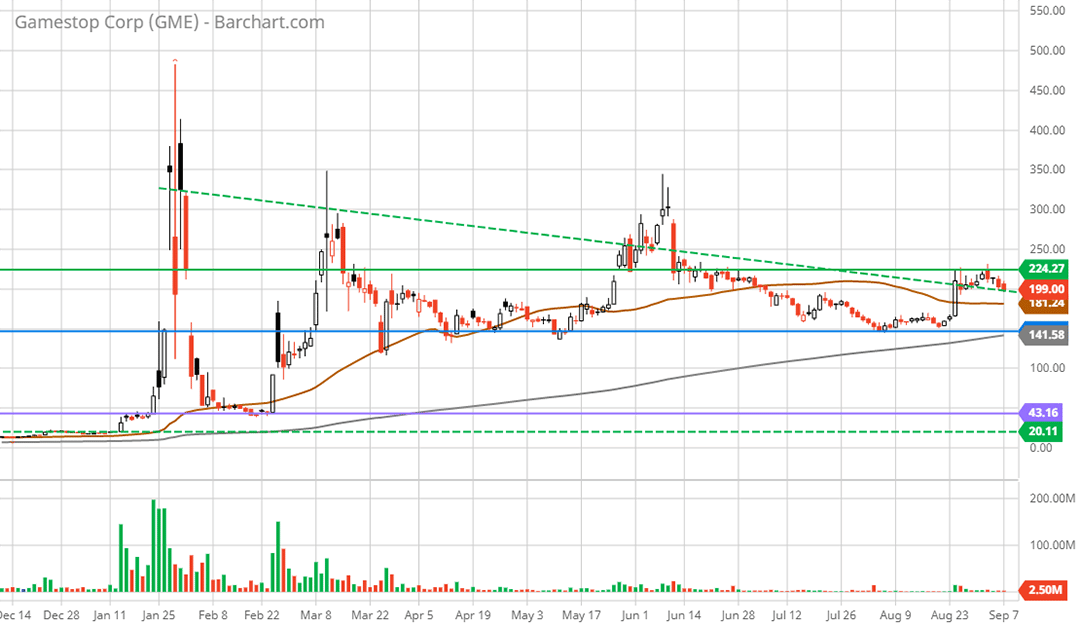
Technical backdrop: GameStop traded sideways for much of the past decade until the short squeeze higher from $10 to $480. Due to the fundamental weakness underlying the business and the resulting lack of valuation support covered above, the stock is driven by the technical picture which has unfolded this year. In the following 9-month daily chart, there are three well defined technical levels identified by the colored horizontal lines (green, blue, and purple).
Overhead resistance is at the green line near $224 after which there is little resistance should a speculative frenzy reignite. The nearest support level is at the blue line near $147 which has been lower support since March of 2021. This level has been repeatedly tested suggesting a break lower is becoming more likely.
If the break lower occurs, the next support zone is not found until the purple line near $43. This was resistance before the parabolic move higher in January of 2021, and support after the subsequent crash in February 2021. As things stand, this is likely to offer firm support for those looking to speculate on the successful execution of the GameStop Reboot strategy and it aligns well with the $55 price to sales target arrived at in the valuation section.
Technical resistance: The primary resistance level is $224.
Technical support: The three primary support levels are $147, $43, and $20.
Price as of this report 9-8-21: $200
GameStop Investor Relations Website: GameStop Investor Relations


