Risk/Reward Rating: Negative
The year is 2312, human beings inhabit Mercury in a city on tracks always gliding along the surface of the planet to stay in the shadow of the sun so as not to be incinerated. This is the setting for 2312, a science fiction novel by Kim Stanley Robinson. An excerpt from the “Prologue” will set the stage for a review of Sunrun (Nasdaq: RUN). This is an unusual introduction for stoxdox, however the sunwalkers can be seen as an analogy when thinking about Sunrun’s business model. On another note, I highly recommend this book to sci-fi fans.
The sun is always just about to rise. Mercury rotates so slowly that you can walk fast enough over its rocky surface to stay ahead of the dawn; and so many people do. Many have made this a way of life. They walk roughly westward, staying always ahead of the stupendous day. Some of them hurry from location to location, pausing to look in cracks…But most of them are out there to catch glimpses of the sun.
But the sunwalkers know the time, so they wait and watch—until—a flick of orange fire dolphins over the horizon and their blood leaps inside them. More brief banners follow, flicking up, arcing in loops, breaking off and floating free in the sky. Star oh star, about to break on them! Already their faceplates have darkened and polarized to protect their eyes.
The orange banners diverge left and right from the point of first appearance, as if a fire set just over the horizon is spreading north and south…The spill to left and right keeps spreading, farther than seems possible, until it is very obvious one stands on a pebble next to a star.
Time to turn and run! But by the time some of the sunwalkers manage to jerk themselves free, they are stunned—trip and fall—get up and dash west, in a panic like no other.
Company Overview
Sunrun was founded in 2007 with the vision to create a planet run by the sun. The company’s mission is to provide customers affordable solar energy and storage along with a best-in-class customer experience. The Sunrun value proposition is to remove the high initial cost and complexity of cash solar system sales and installation expenses in the residential market while streamlining system maintenance and financing for its customers. As a result, the crux of the Sunrun business model is providing a financing and service solution for long-term (20-25 years) solar energy system contracts in the residential marketplace.
The company itself can be thought of as a middleman or residential solar platform as it coordinates and services all aspects of the solar power lifecycle for residential customers. To execute this business model, the company relies on numerous third parties for all aspects of the solar systems: financing, products, installation, and maintenance work. Sunrun remains the responsible party for the lifetime performance of the systems and the liabilities that may arise over the long-term customer contract. This creates long-term unquantifiable risks for the company that are not well understood given that widespread residential solar systems are still a young market with limited historical performance and depreciation data.
In summary, the company is providing long-term financing and servicing solutions for capital-intensive solar energy systems while relying on third parties to perform on its behalf. A review of Sunrun’s recent financial performance through Q2 of 2021 will illuminate the challenges faced by its business model and the reason why I view Kim Stanley Robinson’s sunwalkers of Mercury as a great analogy of the company’s business model.
Financial Performance: Cash Flow
I last reviewed Sunrun many years ago and was inspired to do this update by recent investment industry comparisons of Sunrun to a software company for valuation purposes. This struck me as odd given my understanding of the software as a service (SaaS) business model and my understanding of the Sunrun business model from my review years ago. The software as a service business model offers extraordinary and recurring profit and free cash flow margin potential. As a result, the successful SaaS companies normally receive extremely high valuation multiples on profits and free cash flow.
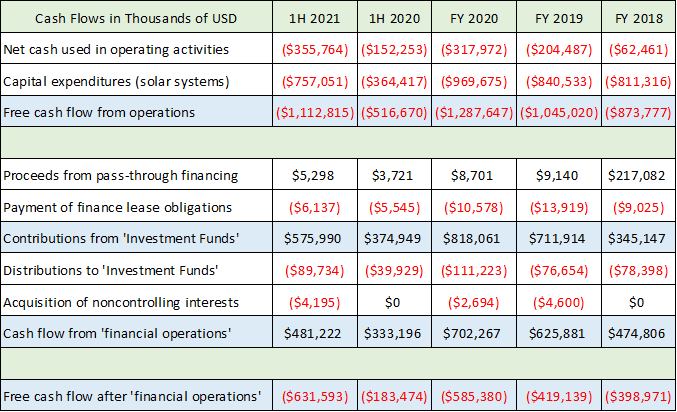
Seeing people use software-like valuation multiples for Sunrun led me to ask the question: had Sunrun’s business model changed recently? The following table uses data compiled from Sunrun’s most recent 10-K annual report and 10-Q quarterly report filed with the SEC. I compare the results through the first half (1H) of 2021 with the same period last year as well as the last three full years (FY 2018 through FY 2020). I have abbreviated some of the row labels in the cash flow statement from the SEC filings for clarity and brevity.
Please note that Sunrun has extraordinarily complex financial arrangements which are by their nature opaque in public financial filings and for which I have done my best to estimate and simplify. Additionally, given the financing nature at the crux of the Sunrun business model, an analysis of the cash flow statement differs materially from that of other businesses and necessarily requires subjective judgment which will differ materially between financial statement users. What follows is my opinion as to the best way to view Sunrun’s cash flow results.
Working our way down the statement, Sunrun historically has generated large and growing negative cash flows from operations (first blue shaded row). In fact, the company has generated over -$1.1 billion of negative free cash flow from operations through the first half of 2021. This is double the cash outflow through the first half of 2020 and is nearly equal to the cash outflow for the entire year of 2020. Approximately 70% of the outflows are due to the capital expenditure intensity of the solar systems being installed. Excluding these solar system capital expenditures, the negative cash flow from operations (first row) is growing even more rapidly through the first half of 2021 compared to the first half of 2020 and has already surpassed the full year 2020.
Recall from the business model discussion that Sunrun is essentially financing the solar systems. This requires one to adjust the traditional free cash flow from operations calculation (cash flow minus capital expenditures). The second section of the cash flow statement above attempts to adjust free cash flow from operations for these ‘financial operations.’ Sunrun relies on investment demand for US Federal tax credits to finance its solar systems. The company reports 63 tax equity investment fund partners in its 10-K. Contributions of cash from these funds are the largest source of ‘financial operations’ cash inflow (second blue row highlighted in the table).
Summing all of the cash flows from ‘financial operations’ for the first half of 2021 results in a cash inflow of $481 million (third blue shaded row in the above table) which pales in comparison to the -$1.1 billion negative cash flow from operations (first blue shaded row). As a result, the free cash flow from operations after the ‘financial operations’ was -$631 million through the first half of 2021 (final blue shaded row). This first half cash outflow has already surpassed the full year 2020 outflow of -$585 million.
Based on the cash flow performance of Sunrun in recent years through Q2 2021, I see that not much has changed since my last review years ago. The business model looks nothing like that of a software company and looks more like a combination of a heavily capital-intensive business combined with a complex financing operation.
Free cash flow generation for Sunrun looks similar to the sun for the inhabitants of Mercury in Kim Stanley Robinson’s 2312. The sunwalkers desperately want to see the sun but they can never fully be in the sun given the extreme radiation will kill them. Similarly, Sunrun desperately wants to reach free cash flow generation while creating a planet run by the sun but the business model itself seems to preclude the possibility.
Financial Performance: Income
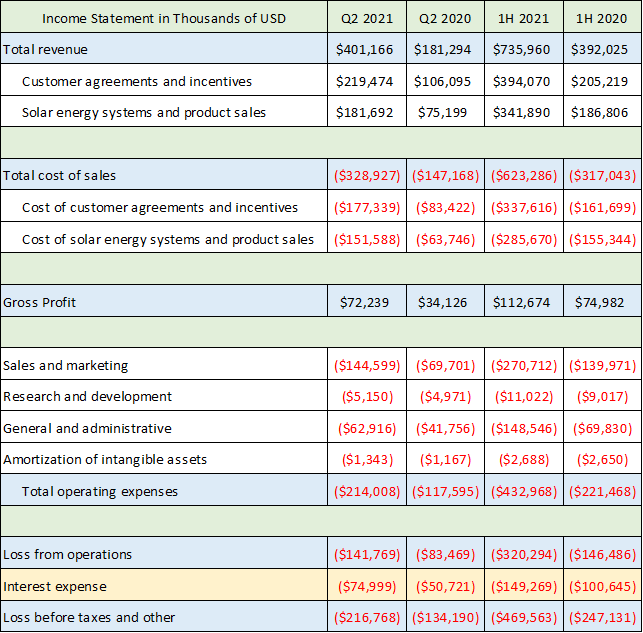
The income statement may offer a more hopeful view of the trends underlying the business. Generally accepted accounting principles (GAAP) are designed to align income and expenses in the time period in which they are economically incurred in the income statement (as opposed to the cash flow statement which is in real-time). Thus, given Sunrun’s large capital expenditure requirements for solar systems (35-year life) and long-term customer contracts (20-25 years), the income statement should look better than the cash flow statement. The table below uses data compiled from Sunrun’s recent Q2 2021 10-Q quarterly report filed with the SEC.
In the table above, I have highlighted the critical summary data in blue and yellow from the income statement while providing more granular detail for those interested. Since we are looking to contrast the accounting income with the cash flow statement, the bottom line is the logical place to start (final blue row). The loss before income taxes came in at -$470 million through the first half of 2021 and grew by 90% compared to 2020. This is extraordinary growth in reported losses but less than the 244% growth in negative free cash flow after ‘financial operations’ noted in the first table. This is in line with the long-term, capital-intensive nature of the business model and was expected (net income loss less than the negative free cash flow).
The interest expense line, second row from the bottom highlighted in yellow, tells an important story as to what is filling the void left by the extraordinary growth in negative free cash flow discussed above, which is debt. In fact, the interest expense is growing rapidly at 50% compared to 2020. Sunrun is turning to debt to plug the negative cash flow hole.
While revenue growth was strong at 88% in the first half of 2021 (first blue shaded row), gross margin dollars (third blue shaded row) grew at roughly the same rate highlighting the lack of operational leverage in the business model. In fact, total operating expenses (fourth blue shaded row) grew at a similar rate as revenue further reinforcing the lack of operating leverage in the business model.
It should be noted that the cost structure is rising throughout the solar and roofing supply chain which is likely to amplify the negative income and cash flow trends currently in place. The sunwalker analogy from 2312 is reinforced by the income statement as Sunrun wants to see net income, however the business model itself seems to preclude the possibility.
Financial Performance: Balance Sheet
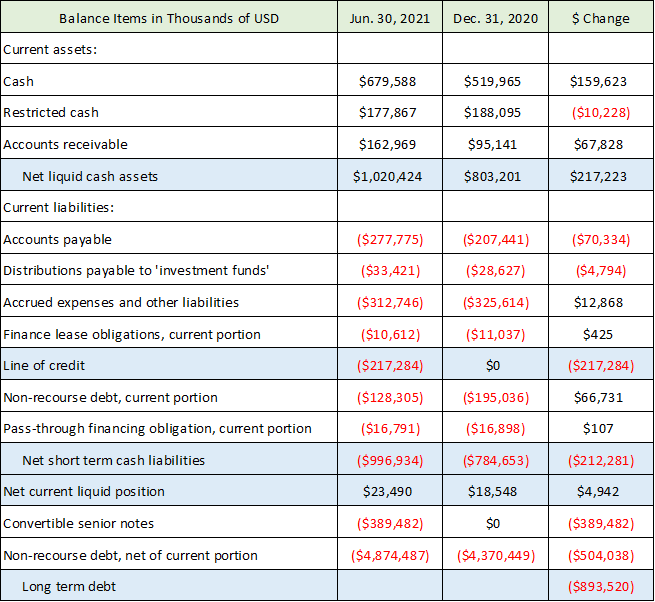
As discussed in the income statement, debt is being used to fund the operating losses and negative free cash flow from operations. The data in the table below was compiled from the balance sheet presented in the company’s recent 10-Q quarterly report filed with the SEC. Please note I am focusing only on the liquid cash assets and liabilities and long-term debt for this discussion.
The first thing to jump out is the final row highlighted in blue. Sunrun is plugging the cash outflows on its balance sheet by taking on long-term debt with an increase of $893 million through the first half of 2021. Another notable change is the credit line usage at $217 million (second row shaded in blue). This credit line usage accounts for the $217 million increase in liquid cash assets (first blue shaded row). What Sunrun cannot finance with the sale of tax credits to investment funds (see the cash flow analysis above), it is financing with debt. Recall from the income statement analysis that the interest expense is growing at 50% in 2021 compared to 2020.
It should be noted that the sale of tax credits (which Sunrun relies on) is currently scheduled to phase out materially after 2026 ─ from 30% of solar investment value in recent years down to 10% after 2026. This is a material risk to Sunrun’s business model as it stands today, and it may intensify the need for debt usage if this financing source dries up.
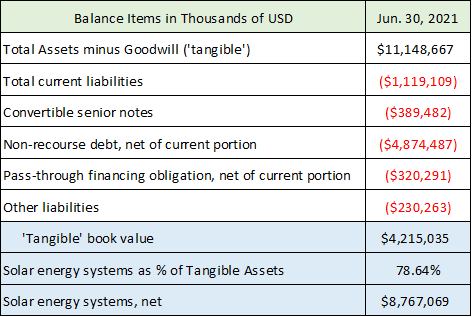
Additionally, the solar installations which account for much of Sunrun’s assets rely on assumptions and calculations which may not prove reliable over time. The following table is compiled from data on the balance sheet in the company’s recent 10-Q quarterly report filed with the SEC. The intent is to illuminate the tangible book value of the company (tangible assets minus liabilities) to better understand the balance sheet flexibility. The information will also be needed for valuation purposes given the loss position and negative free cash flow generation.
The heavy capital expenditures on solar energy systems comprise 79% of Sunrun’s tangible asset base and are valued at $8.7 billion (final two rows in blue). The net tangible book value stands at $4.2 billion (first blue shaded row). The valuation of the solar assets relies on assumptions which may or may not prove reliable. For example, higher interest rates would reduce the carrying value materially. Additionally, the assets are on customer roofs rather than in Sunrun’s possession which makes them fundamentally different than other types of productive assets. Furthermore, there are customer credit risks, change of ownership risks pertaining to the homes on which the solar assets are installed, as well as performance and depreciation risks. There are many more risk factors outlined in the company’s 10-K annual report. Needless to say, assets can and do become liabilities at times.
Valuation
As outlined, Sunrun is not profitable, is not expected to become profitable in the foreseeable future and generates substantial amounts of negative free cash flow. Relying on future free cash flow assumptions is likely to prove problematic given the capital intensity of the business. For these reasons, a valuation of Sunrun is a tricky endeavor. My preferred valuation anchor under these conditions is to fall back on the tangible book value which currently stands at $4.2 billion or roughly $20 per share. The current price of Sunrun is $45.86.
Tangible book value is a meaningful valuation metric for financial firms. As a result of financing being the crux of the Sunrun business model, tangible book value is a valid approach under negative income and free cash flow conditions. Given the future liabilities in maintaining the physical infrastructure, as opposed to pure financial firms, the 1x tangible book value anchor is a good valuation starting point for Sunrun and would provide a greater margin of safety for prospective investors.
Summary
Free cash flow and operating income generation for Sunrun look similar to the sun for the inhabitants of Mercury in Kim Stanley Robinson’s 2312. The sunwalkers desperately want to see the sun but they can never be fully in the sun given the extreme radiation will kill them. Similarly, Sunrun desperately wants to reach free cash flow generation and profitability but the business model itself seems to preclude the possibility.
Alternative energy is a noble pursuit and Sunrun has been one of the leaders and is well respected in the field. As things stand, the risks appear to outweigh the rewards at the current share price. For those looking to accumulate a position in the shares, the valuation section provides a possible entry point near $20 based on tangible book value which would compensate for the extreme risks inherent in the business model. Looking to technical analysis and the charts may further illuminate possible entry levels.
Technicals
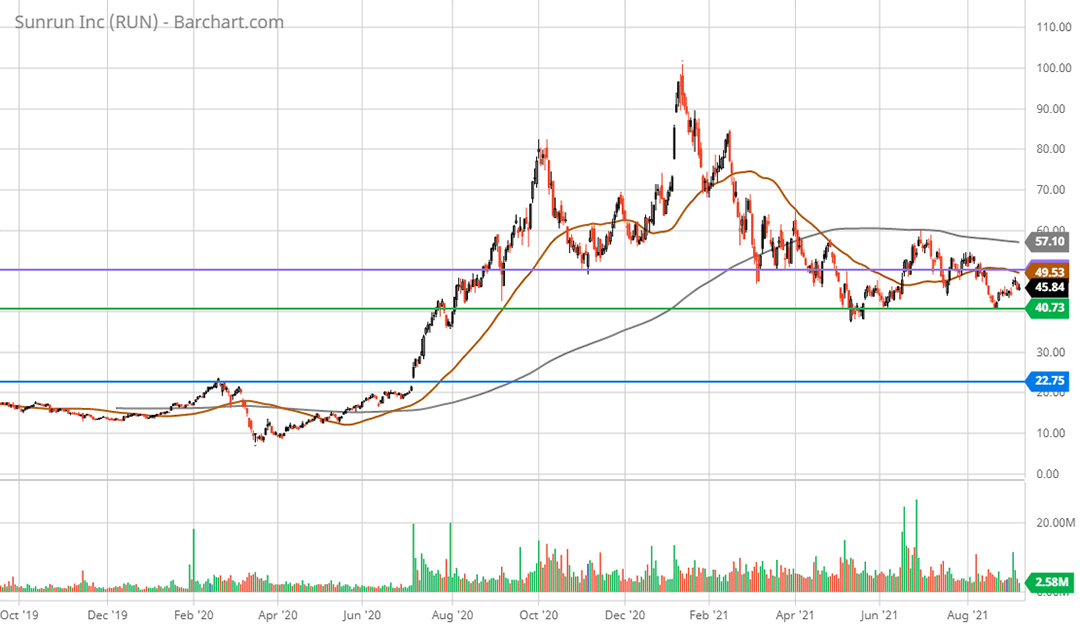
Technical backdrop: Sunrun went on a speculative run from July of 2020 through January of 2021, rising from $20 to $100 during the most frenzied period of the current bull market. The price proceeded to collapse over 50% in the following two months and has been trying to find a bottom ever since. As can be seen on the following 2-year daily chart, the share price has been range bound between $40 and $60 since March of 2021.
Resistance stands nearby in the $50 area (purple horizontal line) which was broken support from March and April of 2021 and served as resistance as recently as August of 2021. It should be noted that the 50-day moving average (brown line on the chart) is below the 200-day moving average (grey line on the chart) which points toward a primary downtrend being in place. This ‘death cross’ (the 50-day moving average crossing beneath the 200-day moving average) occurred on April 20 of 2021 and is now well entrenched.
Nearest support is near $40 (green horizontal line) which was the May 2021 low area and was resistance before the speculative blowoff in July of 2020. Next lower support after this level is near $20 (blue horizontal line) which was resistance in February of 2020 and the region of the initial gap higher on July 7, 2020. This lower support level near $20 looks to be more reliable and also aligns with the tangible book value discussed above.
Technical resistance: $50
Technical support: the two well defined support levels are $40 then $20. The $20 level appears to be the nearest possible opportunistic accumulation level.
Price as of this report 9-7-21: $45.87
Sunrun Investor Relations Website: Sunrun Investor Relations
Data in this report is compiled from the Sunrun investor relations website and SEC filings, and where applicable publicly available information regarding consensus earnings estimates.

