Risk/Reward Rating: Negative
The Trade Desk is the leading technology platform for buyers of advertising. The company staggered briefly in Q2 2020 on the initial COVID shock but quickly regained its growth trajectory. While business is strong, the stock price has been even stronger taking the valuation to a precarious level. The recent 10 for 1 stock split would suggest the company is trying to broaden its investor base as these valuation constraints have come into play.
Valuation: 122x 2021 non-GAAP earnings estimates and 106x 2022 non-GAAP estimates. As with many technology companies, share-based compensation expense is quite large. The exclusion of these expenses is the primary driver of non-GAAP profitability compared to actual income reported under generally accepted accounting principals (GAAP). For example, income from operations before tax was $7.8 million in Q1 2021 while the non-GAAP reported net income was $70 million. Stock based compensation is an economic expense and needs to be weighed by investors.
The valuation compared to sales is at levels that normally ends in tears. The current price is 46x 2020 sales and 32x estimated 2021 sales. As a reminder, Q2 2020 showed a decline due to the initial COVID shock which slowed 2020 sales growth to 26% versus growth of 39% in 2019. Estimated sales for Q2 2021 will look extraordinarily strong versus the Q2 COVID decline last year. When viewed versus Q2 2019, it would appear that the company is growing revenue in the 32% range at the moment. This growth rate should become more difficult to maintain as the numbers get larger.
While The Trade Desk is a great company and is leading its industry, the valuation is pricing in much of the foreseeable future at these levels leaving little on the table for new investors. For example, the stock sold off 26% in one day after the Q1 2021 earnings report. This type of downside risk is to be expected when valuations are extreme and there is even the slightest hint of slowdown or disappointment.
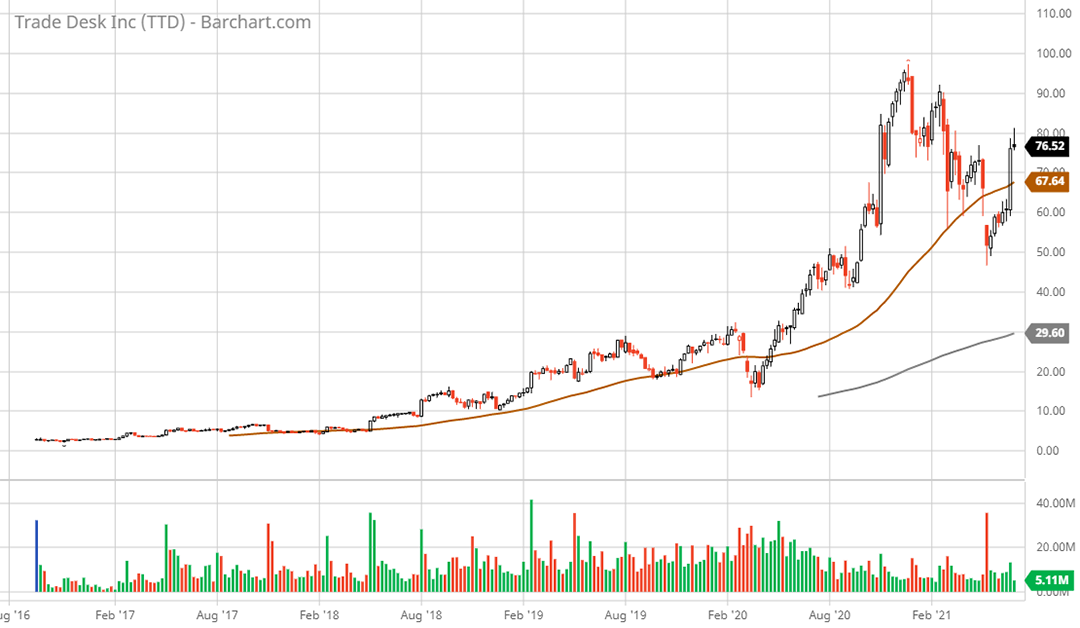
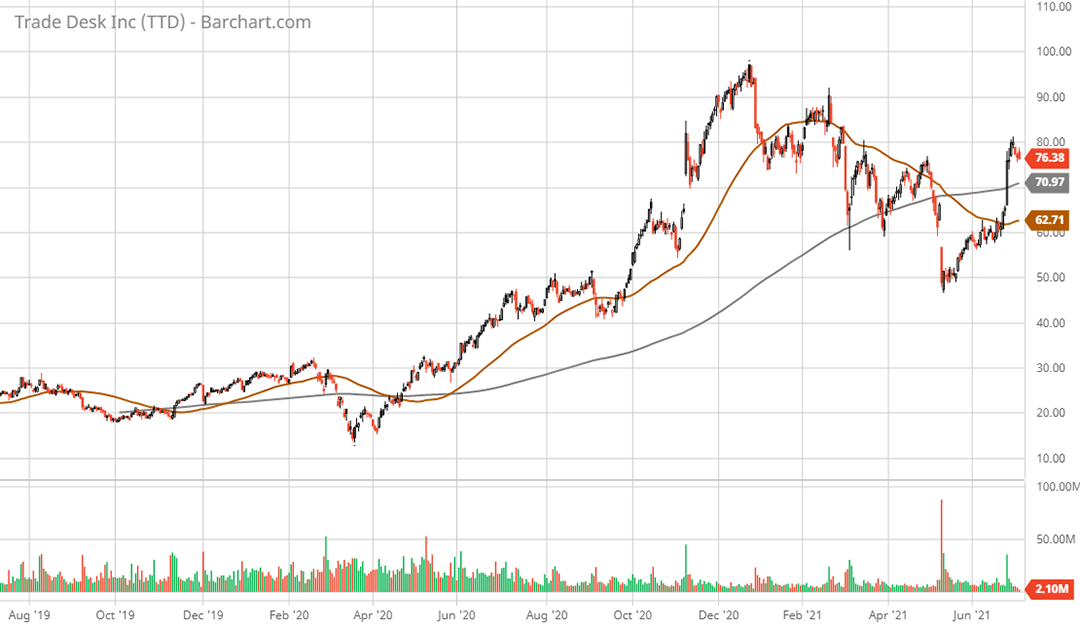
Technical backdrop: The stock is overextended to the upside. This can be seen on the 5-year weekly chart. The 200-week moving average is at $29.60 (grey line). The 26% selloff on May 10, 2021 suggests support areas are tenuous at these extreme valuation levels. Given the valuation, the $30 level is not out of the question. Furthermore, the stock bottomed at $46 less than two months ago.
Technical resistance: At current levels in the $77 to $80 range.
Technical support: $60 then $50 which was recently tested. Next lower support is in the $30 area.
Price as of report date 7-2-21: $76.61
The Trade Desk Investor Relations Website: The Trade Desk Investor Relations


