Risk/Reward Rating: Negative
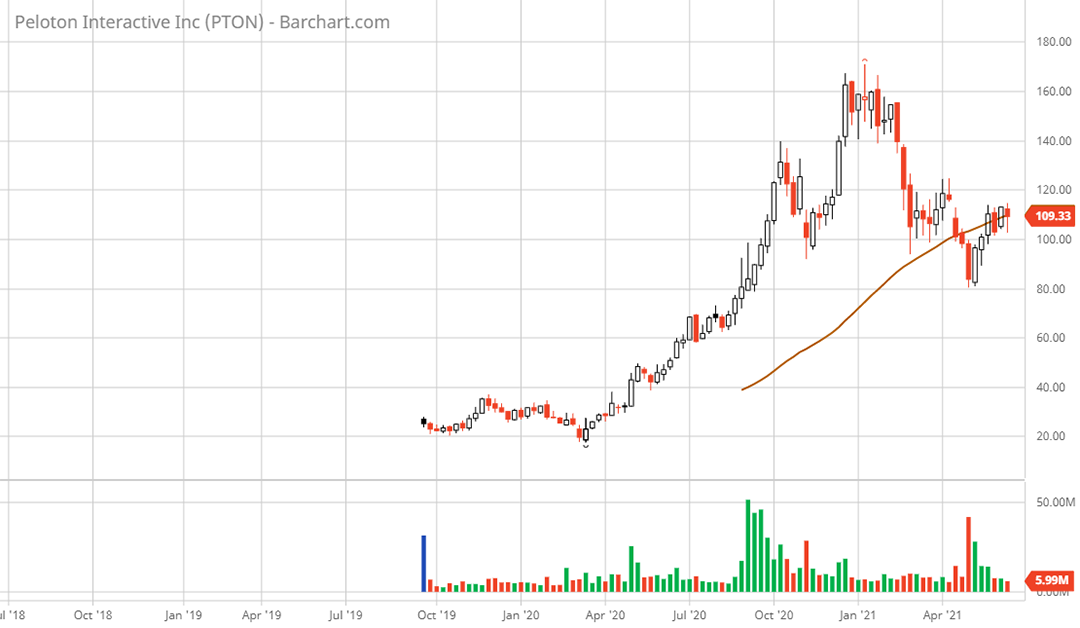
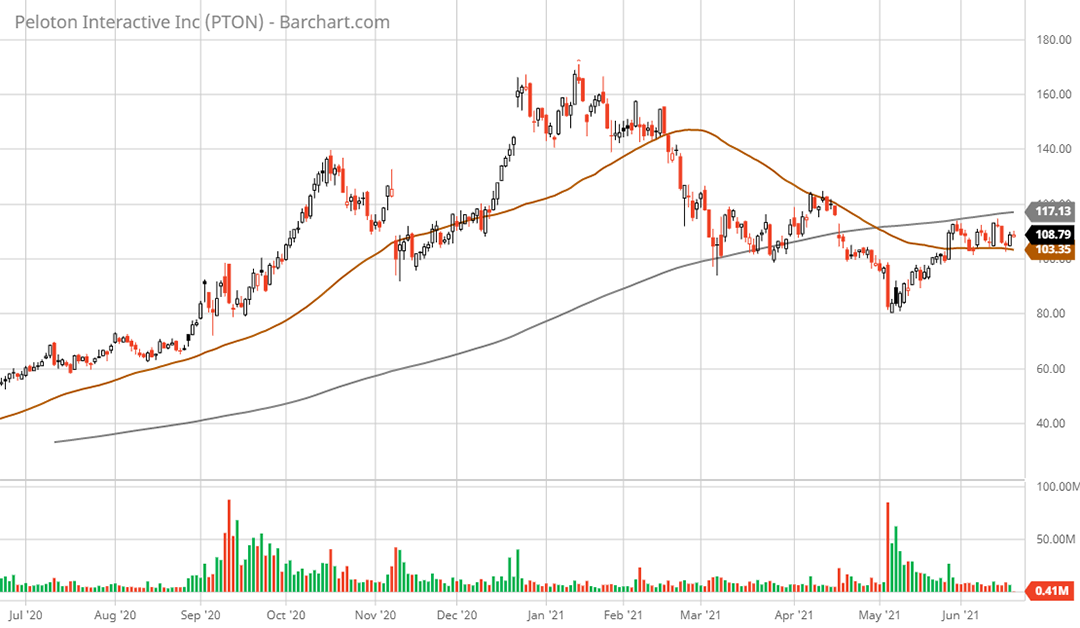
Peloton was one of the largest beneficiaries of the COVID crisis as people rushed out to purchase exercise equipment and content while in lockdown. The stock topped out in January of 2021 as a return to normal came into view. Ominously, a death cross was consummated on 4-30-21 with the stock’s 50-day moving average piercing beneath the 200-day moving average.
In the process, a weekly head and shoulders top has now formed with a neckline in the $110 area, which the stock is battling to overcome. A daily head and shoulders top pattern is also in play with a neckline in the $100 area. The $100 daily neckline was breached on 4-30-21 coincident with the death cross. Peloton stock faces a daunting technical setup.
The fundamentals for the company are returning to more normalized demand conditions as lockdowns are lifted. However, the supply chain has been stressed by this excess demand over the past year as well as the timing of recalls due to consumer injuries. The inability to meet demand and the costly recall process highlight the weaknesses in Peloton’s supply chain and reliance on offshore manufacturers. The company announced it is building a $400 million manufacturing facility in Ohio, which evidences the increasing cost structure for the business model.
Valuation: 242x 2022 earnings estimates which is extreme in a historical stock market context. The company produced $191.4 million in free cash flow through the first nine months of the current fiscal year, or $255.2 million annualized. The valuation is 127x free cash flow on this basis. Free cash flow should decline near term given the capital spending requirements and supply chain constraints.
Peloton could be a long-term investment opportunity at a more attractive valuation entry point assuming the successful execution of a larger fitness subscription-based business model which would feature higher margins than hardware.
Technical resistance: $110 at the weekly head and shoulders neckline and $117 at the 200-day moving average.
Technical support: $70 area is next lower support after the $100 area which looks susceptible to being breached.
Price as of report date 6-18-21: $108.76
Peloton Investor Relations Website: Peloton Investor Relations


