An interesting feature of today’s market environment, in relation to the leading growth stocks, is that there is a missing character in the innovation trade, 3D printing. With post-Covid onshoring and regionalization of supply chains a clear and likely secular trend, one could postulate that it is a case of now or never for the additive manufacturing industry.
The Razor and Blade Model
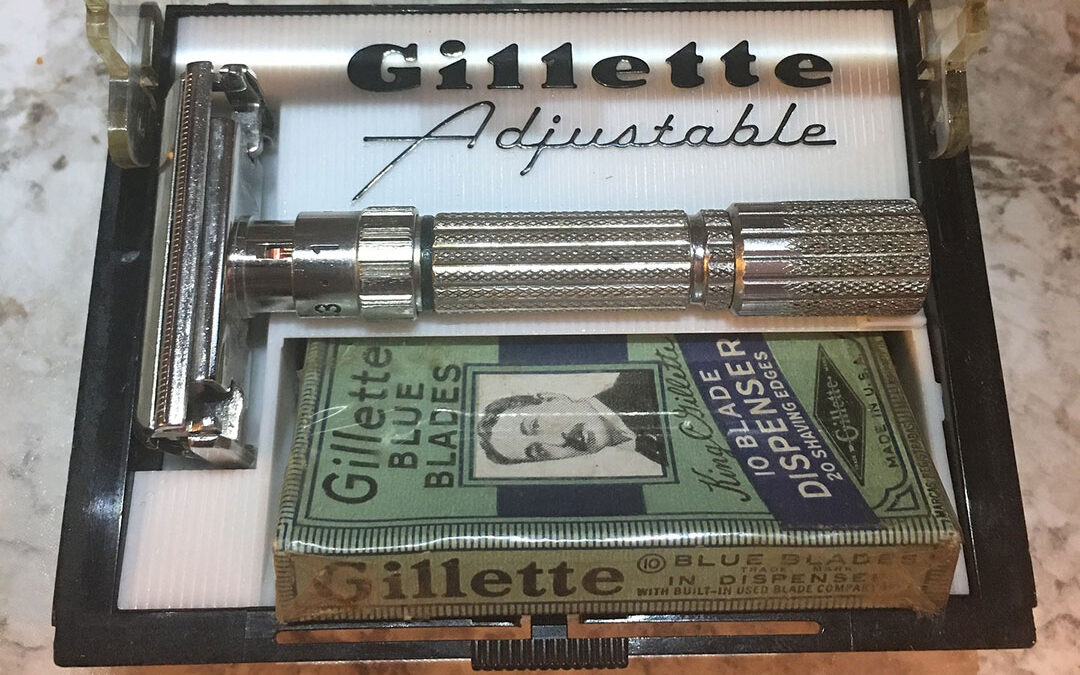
During the mid to late 1990s, Gillette was highly regarded as one of the top growth stocks of the day. The high regard was tied to the company’s business model, which is best summarized in the saying: “give away the razors to sell the blades.” It can be an ideal business model as high frequency consumption of a consumer staple product creates the conditions for attractive economics.
3D Printing – Additive Manufacturing
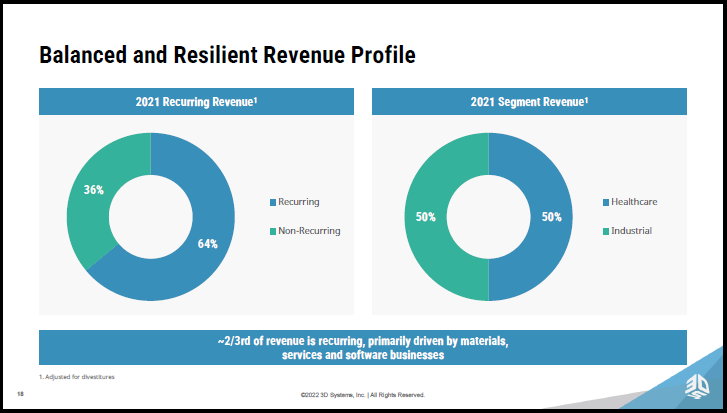
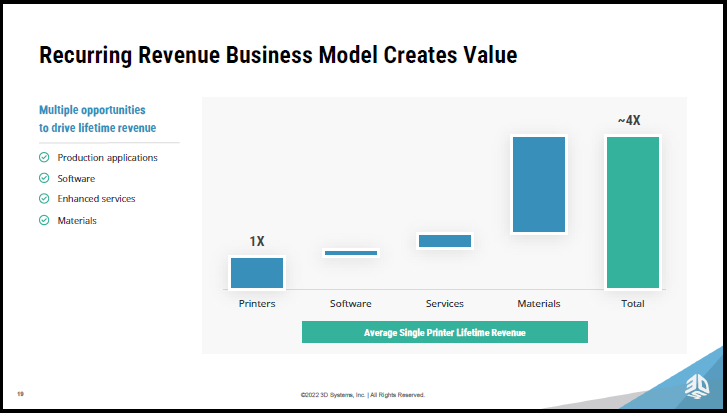
While profit margins similar to a top consumer staples company are highly unlikely for the broad additive manufacturing industry, there is the potential for various manufacturing sector equivalents. The key to higher margin, higher volume goods and services in 3D printing is in the consumables (the “ink”), software, and services. The following slides from 3D Systems’ (NYSE:DDD) August 2022 investor presentation capture the essence of the “razor and blade” product mix potential.
In the first slide, recurring revenue accounts for 64% of sales, and healthcare, a noncyclical industry, accounts for 50% of sales. The second image captures the “razor and blade” business model by displaying the relative size of recurring revenue to the total value that 3D Systems expects to realize from each installed printer. In the case of 3D Systems, the sale of materials far outweighs actual printer sales. Give away the printer and sell the “ink” as it were.
Materialise
As 3D Systems is operating at near breakeven cash flow levels today with sales in the $550 million range, it serves to highlight the relative margin opportunities in the 3D printing space. For reference, 3D Systems is targeting sales of $1 billion by 2027 with a 20% adjusted EBITDA margin. This would translate into $200 million of adjusted EBITDA per year by 2027.
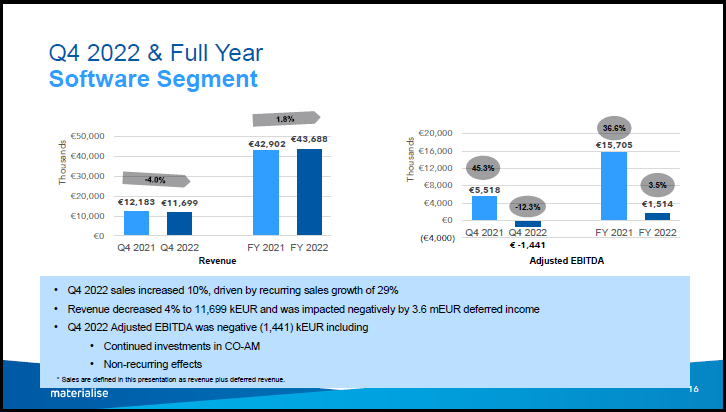
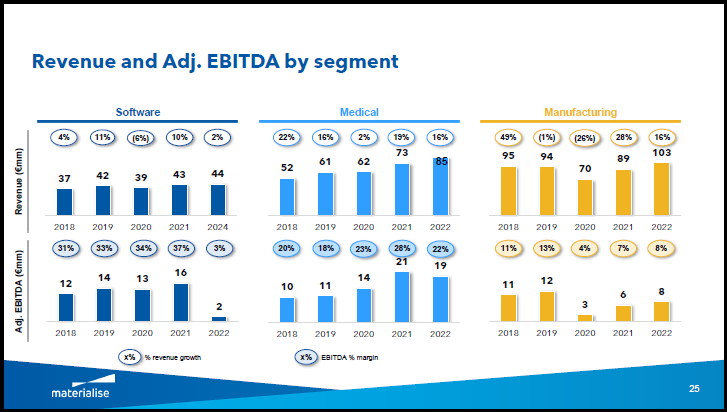
In comparison, Materialise (NASDAQ:MTLS) produced $232 million euros of sales in 2022 and $29 million euros of adjusted EBITDA, for an adjusted EBITDA margin of 12%. If one used its 2021 adjusted EBITDA figure in its software segment to represent Materialise’s margin potential, the adjusted EBITDA figure would be $43 million, for a margin of 18%. Materialise’s economics are far superior to those of 3D Systems.
Materialise is forecasting $25 to $30 million in adjusted EBITDA for 2023, while the consensus sales estimate for 2023 is $285 million. With approximately 59 million shares outstanding and trading at $9.66 per share, Materialise is valued at 21x its 2023 adjusted EBITDA projection and 2x the consensus sales expectation for 2023. All things considered, the valuation appears quite reasonable given the growth potential in additive manufacturing.
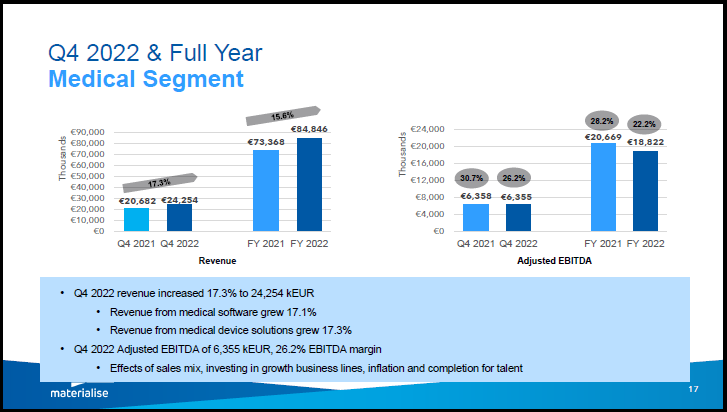
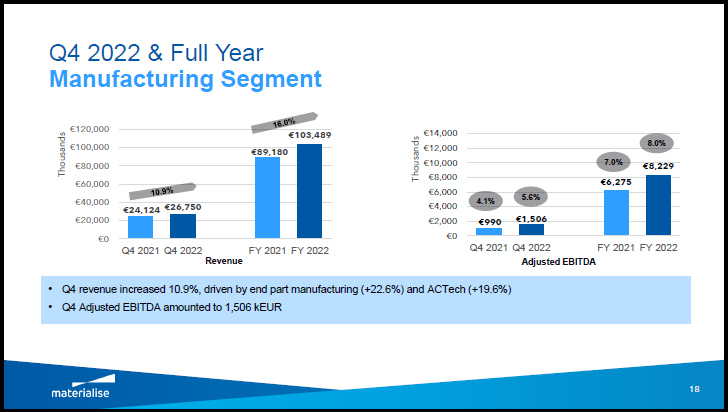
The following slides from Materialise’s February 2023 investor presentation include the above details and provide an overview of Materialise’s business segments. Note that software is currently subdued while medical and manufacturing are growing quite nicely. The final slide in this section summarizes the recent history of each segment. Note the historical EBITDA margins for each segment on the final slide. The historical margins confirm that the key to a high margin 3D printing business is not in the printers themselves (the manufacturing segment), but in the “ink”: software, services, and materials.
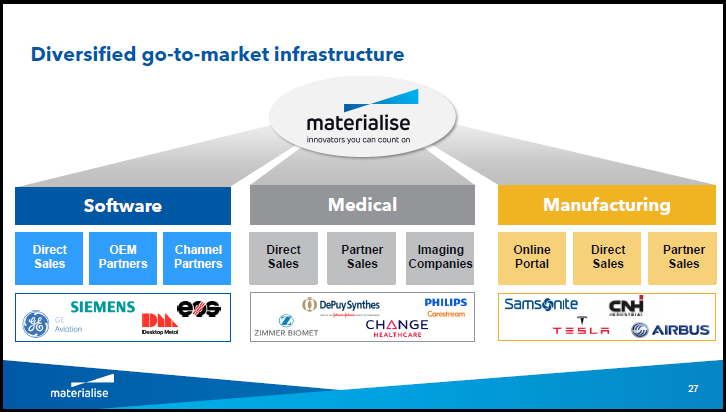
The following image from the same presentation summarizes Materialise’s distribution channels and end markets. In the manufacturing segment, Tesla is an interesting client as it is growing production quite rapidly while exploring advanced manufacturing techniques. You will also notice industry leaders across all business segments which include GE, Siemens, Zimmer Biomet, Phillips, and Airbus.
Industry Projections
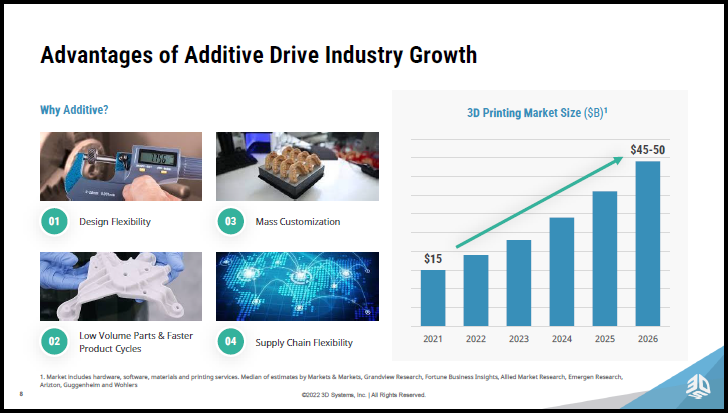
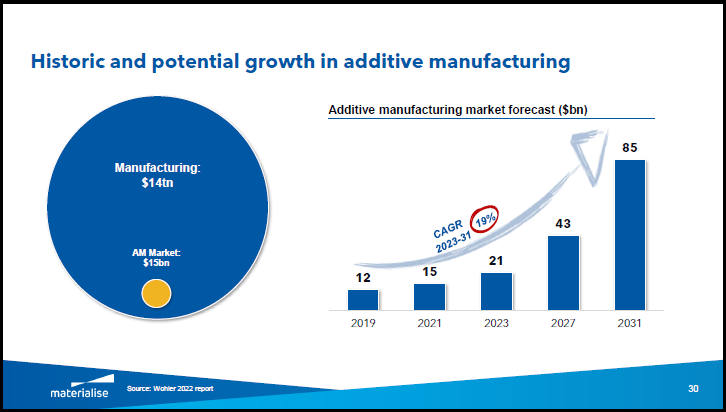
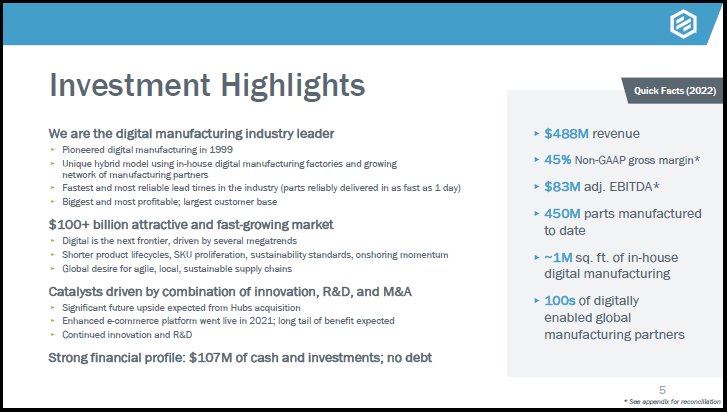
Materialise’s valuation of 21x its 2023 adjusted EBITDA forecast and 2x its consensus sales estimate should be placed in context of industry growth projections. The following images are from the 3D Systems and Materialise presentations as well as Protolabs’ (NYSE:PRLB) May 2023 investor presentation.
The market size estimates provided by 3D Systems and Materialise are nearly identical, pegging the 3D market at $15 billion annually in 2021. Each company is forecasting industry sales in the 2026 to 2027 timeframe to be in the range of $43 billion to $50 billion. If in the ballpark, these projections equate to an annual sales growth rate of 22% for the industry. Looking through 2030, Materialise estimates the market size to be $85 billion in 2031, while Protolabs describes the market size as $100 billion plus.
Consensus Estimates
The above-growth estimates through mid decade look to be realistic. This is especially true given the underlying trend toward onshoring, the buildout out of regional supply chains, and the likely uptake of 3D printing and other advanced manufacturing technologies in the process.
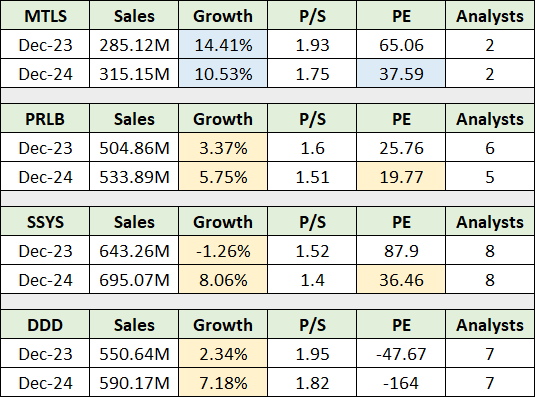
With the industry estimating 22% sales growth per year through 2030, consensus sales growth estimates can be placed in the proper context. The following table displays consensus sales growth estimates as well as the PE ratio using the consensus earnings estimate for Materialise and three of its peers. For ease of comparison, I have highlighted in blue the key Materialise data and in yellow the three comparable companies.
Please keep in mind that the 3D printing stocks are lightly followed by analysts and are often thinly traded, thus introducing enhanced volatility and risk. You will notice above that Materialise possesses a superior sales growth profile compared to its peer group. What is most interesting for the group is that consensus sales estimates through 2024 look nothing like the 22% per year growth estimates circulating within the industry. Given the large disconnect, though the industry may be too optimistic, there is likely to be material upside surprise potential into the 2024-to-2025 timeframe.
Protolabs stands out as the value opportunity of the group at 20x the 2024 consensus estimate. In my experience, having followed the group throughout the years, Materialise and Protolabs have consistently stood out as the top two opportunities in the industry. This remains the case today keeping in mind that the industry could experience rapid change which could alter the relative landscape. As a result, I will review the technical setup for Materialise and Protolabs below.
Technicals
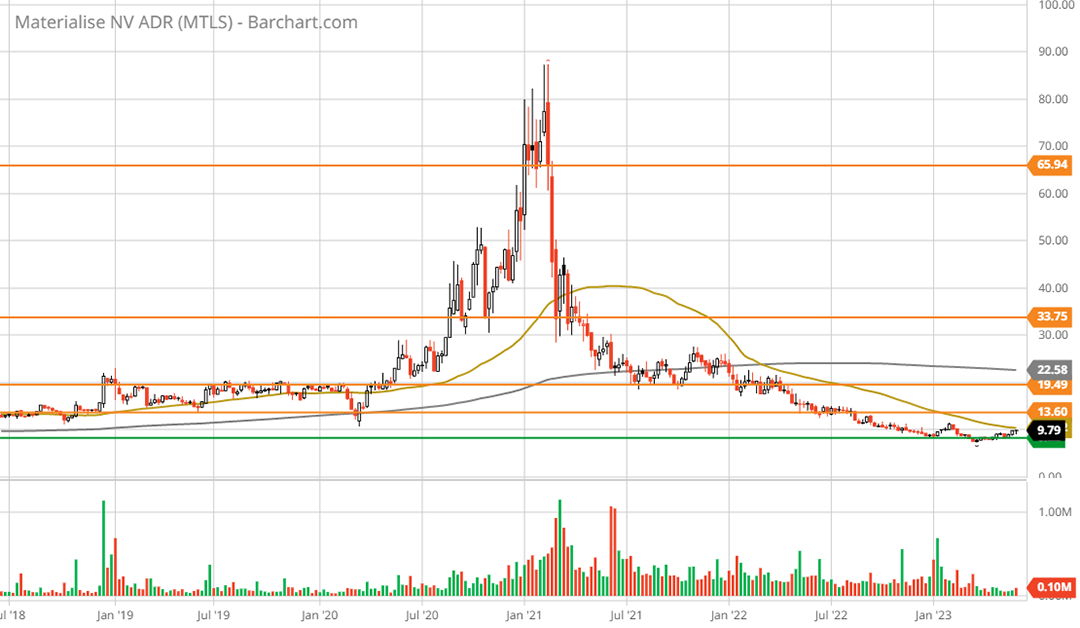
Materialise’s stock is testing its all-time lows of 2015 which followed its June 2014 IPO. The green line on the following 5-year weekly chart denotes this key support level, which is the only visible support level. Key resistance levels, or upside technical price targets, are denoted by the orange lines.
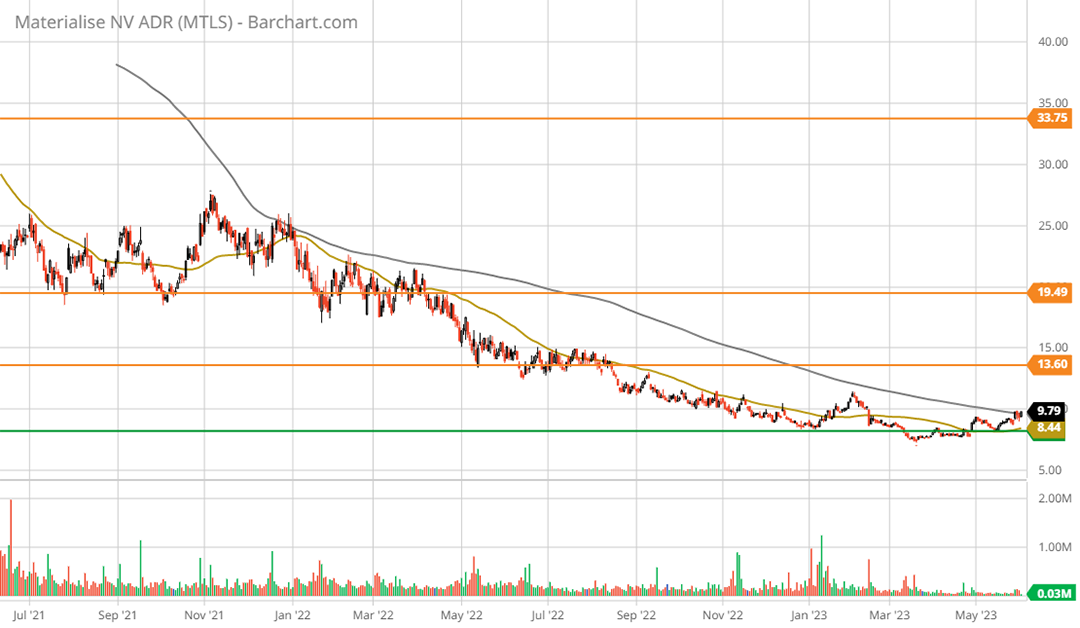
Zooming in, the 2-year daily chart provides a closer look at Materialise’s recent price action.
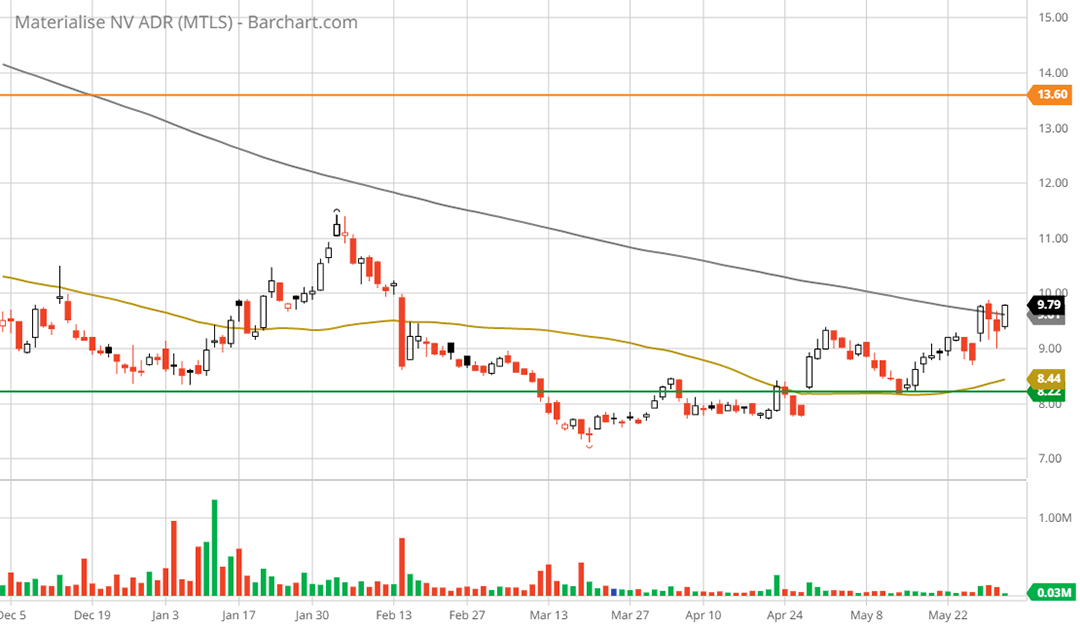
Notice the bottoming formation that developed over the past three months at the key support level. The shares traded sideways in what looks like a flat EKG, for a stock that is. This can be seen more clearly in the following 6-month daily chart.
In context of what looks to be a double bottom at the all-time lows over the past three months, and renewed, if tepid upside momentum, Materialise is within an ideal accumulation window .
Protolabs
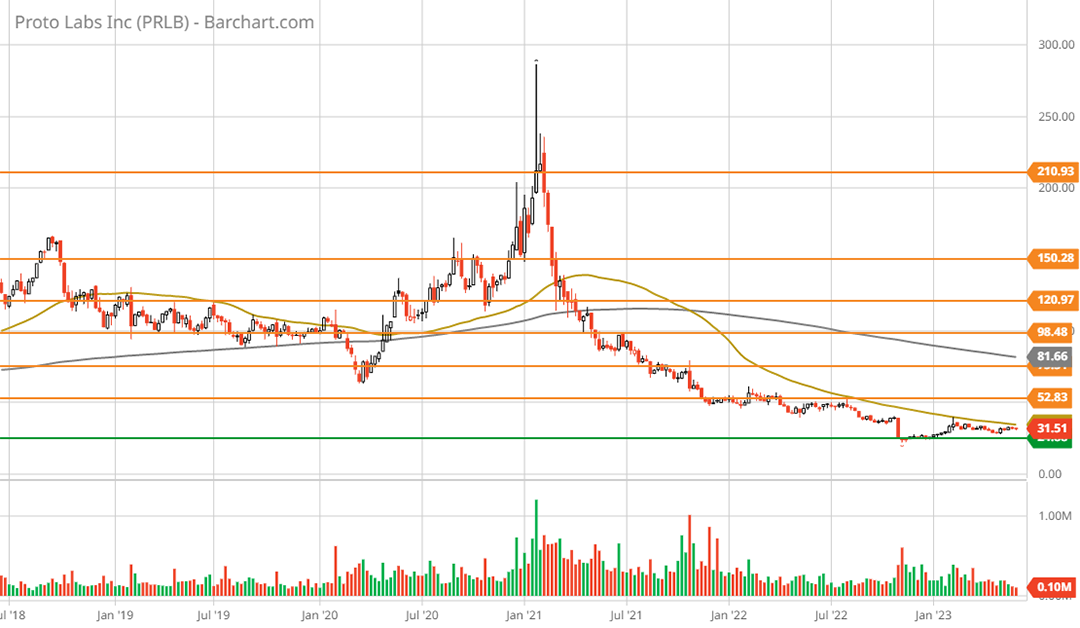
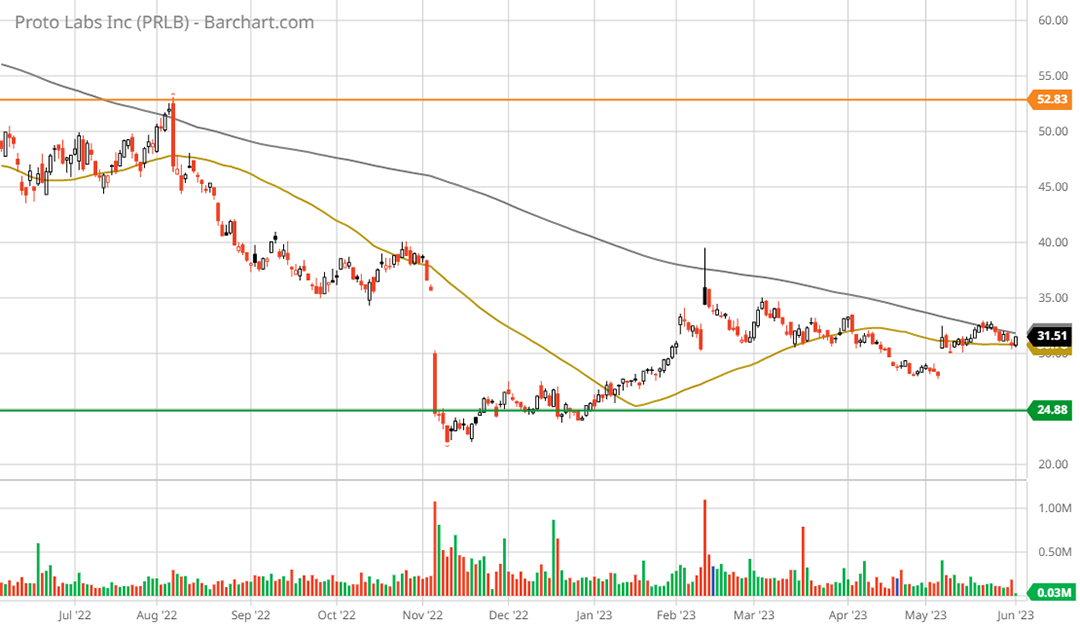
The technical backdrop for Protolabs is quite similar to that of Materialise. Note that the color scheme on the charts remains the same, with the orange lines denoting the key resistance levels and the green line denoting the only support level visible. The following 5-year weekly chart captures each level and the recent test of all-time lows following Protolabs’ 2012 IPO.
The 1-year daily chart below captures the recent price action.
Potential Return Spectrum
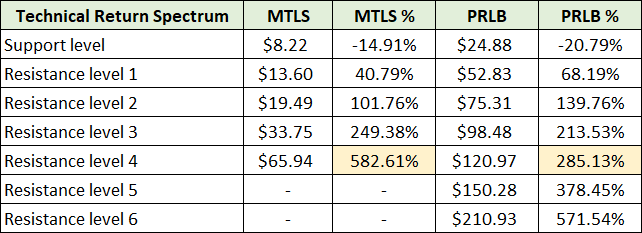
Protolabs put in its own double bottom in late 2022, three months prior to Materialise. Additionally, similar to Materialise, Protolabs has gained initial, if tepid, upside momentum. The following table summarizes the potential return spectrum for Materialise and Protolabs using the technical support and resistance levels in the above charts as price targets.
I view Materialise as the top opportunity in the group given its superior business model, margin structure, and its peer-leading growth outlook. Protolabs is the runner up of the group and is an interesting opportunity for the early phases of the additive manufacturing adoption cycle.
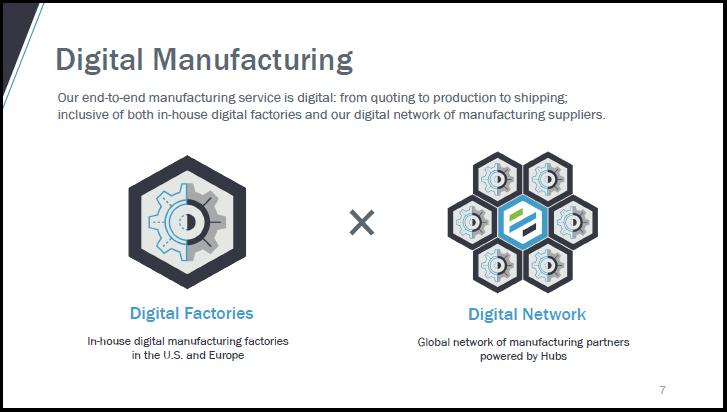
Protolabs is highly leveraged to the manufacturing side of the additive manufacturing industry compared to its peers. While this is a negative for the business model over the long term, it could provide operational leverage under conditions of strong demand and tight supply. Though a net business model negative, the manufacturing focus enhances the potential for upside surprises. The following slides from Protolabs’ investor presentation summarize its manufacturing focus.
Summary
What we can say for certain about 3D printing and the additive manufacturing industry generally, is that it is highly likely to experience a well above-average growth rate through 2030. From a business model perspective, the historical evidence points toward a “razor and blade” opportunity with secular growth potential.
Materialise has positioned itself with the razor, via on demand, in-house additive manufacturing capacity, and with many blades. Its superior business model is evident in Materialise’s profitability in relation to its peer group. Additionally, Materialise’s peer-leading consensus sales growth estimates are half that of the annual growth estimates for 3D printing industry, leaving substantial room for upside surprises.
Razor and blade aside, the trend toward onshoring and regionalized supply chains is a reality and opens the door to asymmetric upside potential for Protolabs. Given Protolabs’ leverage to manufacturing activity itself, and in light of the aforementioned trend, Protolabs’ potential for operational leverage enhances the opportunity via upside surprises as additive manufacturing is more broadly adopted.
Materialise and Protolabs stand out as asymmetric risk/reward opportunities in the additive manufacturing industry. As the technology is adopted, the “razor and blade” analogy should remain top of mind for investors when viewing 3D printing investment opportunities. To date, Materialise is the leader in executing the Gillette business model and is the leading additive manufacturing industry equivalent.
Materialise price as of this report: $9.66
Protolabs price as of this report $32.98
Materialise Investor Relations website
Protolabs Investor Relations website

