
stoxdox: Primary Research Reports
Primary research reports anchor the stoxdox service. The reports feature a comprehensive fundamental analysis, a broad technical overview, and a potential return spectrum with associated price targets when appropriate. A key feature of our primary research is the risk/reward rating which can be either positive, neutral, or negative. Or 1, 2, and 3 in the stoxdox – Portfolio Tool, respectively.
The primary research reports are constructed as an intermediate-term foundation and are designed to be an extended framework for approaching each investment opportunity through time, thereby serving as a decision support tool. We call each of our primary research reports a “dox,” hence our slogan: “You’ve got to dox your stocks!”
I will guide you through a primary research report below while relating the various use cases back to the stoxdox – Portfolio Tool.
EOG Resources is an excellent example of the stoxdox platform design. We serve the entire risk/reward spectrum, from conservative/income-oriented investors through aggressive/growth-oriented investors. Enabling maximum use cases across the investor universe. All investors prefer higher return potential with lower risk. EOG is an opportunity for the entire universe of investors.
EOG scores a (1) for its positive risk/reward rating and a (1) for its below-average risk or ē in the stoxdox – Portfolio Tool. On the income score or Ʃ+, EOG receives an average score (2) due to the variable nature of its dividend policy. Please note that ratings of (1) through (3) are always from best (1) to worst (3).
EOG Resources, Inc.
Report date: August 23, 2021
Risk/Reward Rating: Positive
Price as of the report: $67
Price at 6-8-22 peak: $147.99
stoxdox upper target zone: above $130
Price today, 7-22-22: $102.78
Asymmetric risk/reward opportunity:
- Maximum upside since report: 121%
- Maximum downside since report: 0%
Report Excerpts and Use Cases (italics added):
Excerpt: EOG Resources is among the highest quality US oil and natural gas producers. The company has a premium asset base across the most prolific shale basins in the United States, with 54% of production volume coming from oil and 46% from natural gas…
Use Cases: This excerpt speaks directly to our risk equivalent rating or the ē column in the stoxdox – Portfolio Tool. EOG is a blue-chip leader in the oil and gas industry qualifying it for a below-average risk rating.
Keep in mind that the ē rating is a subjective and relative rating. Risk relative to one’s industry peers weighs heavily on the ē rating of below average for EOG. Energy stocks can become quite volatile over an economic cycle. That said, in a portfolio context, this risk can be mitigated through diversification. EOG is likely to reduce overall portfolio volatility through a full cycle.
Excerpt: In addition to the premium asset base, the company is one of the low-cost producers in the industry with a projected breakeven price of $30 WTI oil. At $36 WTI oil, the company projects it can break even while also covering its current dividend payments to shareholders. The premium assets and associated low-cost production provide a competitive advantage through energy price cycles, and a margin of safety for shareholders…
Use Cases: This excerpt further reinforces the below average risk level by highlighting the competitive advantage of being a low-cost producer in a commodity industry. A premium valuation would be natural to expect of an industry leader. Note the potential price targets below for a potential return spectrum.
In the stoxdox – Portfolio Tool, sorting first by ē (ascending) and then by RRR or the Risk/Reward Rating (ascending) would produce a list of opportunities similar to EOG which appeal to the universal investor.
Excerpt: Operations Overview
A breakdown of EOG’s 2021 capital budget…
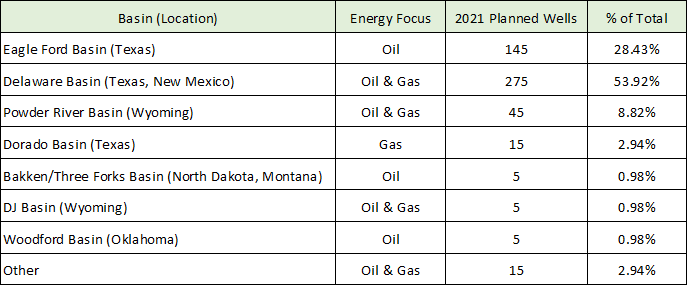
It should be noted that EOG has a strong balance sheet with low debt levels further supporting the premium case for the shares…
Industry Backdrop
The oil and gas industry globally and in the US in particular is looking better than it has in some time…
Use Cases: The positive industry backdrop creates another opportunity for the stoxdox – Portfolio Tool. Adding Sector and Industry as the first two dimensions of a search followed by ascending RRR or Risk/Reward Rating would produce an attractive list of opportunities. This sort is especially useful for targeting commodity sector opportunities.
Excerpt: EOG is trading at meager valuation levels from a historical perspective, especially when compared to extreme valuation conditions in today’s markets. The company is trading at 8.86x 2021 earnings estimates and 8.4x 2022 earnings estimates. These PE multiples are half of historically normal market-wide multiples, and one-third to one-quarter of prevailing market-wide valuations… Adding to the valuation attraction is a 2.44% base dividend, along with additional special dividends and share repurchases when excess cash builds on the balance sheet…
The high quality of EOG’s asset base, combined with its strong financial position and the improved supply and demand conditions in the oil and gas markets, suggest that such a large discount valuation is unjustified for EOG. If oil and gas prices remain near current levels and trend higher over time, the company’s projected free cash flow could become explosive, opening the door for well above average stock returns…
Use Cases: The meager valuation combined with the strong case for a premium valuation points toward material upside potential given the favorable industry backdrop. Be sure to review the potential return spectrum below.
Excerpt: Technicals
EOG Resources has built an incredibly strong technical base on all timeframes (daily, weekly, and monthly). Zooming in to the 2-year daily chart (below), the stock has carved out a large W base which should serve as a solid foundation to support the share price. In fact, the stock is bouncing off support at $62.80 (see the horizontal support line on the daily chart) today with a rally of 5% through midday…
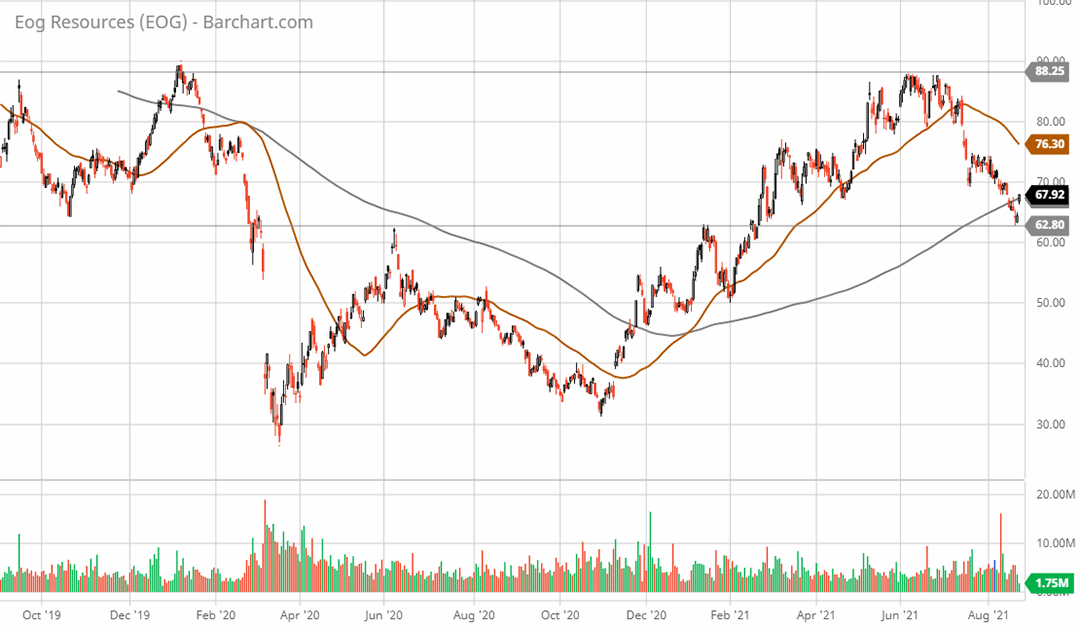
The share price is also breaking back above the 200-day moving average (grey line on the daily chart) at around $67. A bullish read is also provided by the 50-day moving average (brown line on the daily chart) being above the 200-day moving average lending credence to the view of an unfolding uptrend. A move above $88 (upper horizontal trendline on the daily chart) would signal a breakout from the W foundation pattern…
Use Cases: EOG was at an ideal technical position at the time of the report, having pulled back materially in the preceding weeks. Opportunities such as this can be filtered easily with the stoxdox – Portfolio Tool. This also speaks to the core mission of the stoxdox platform: We curate the most asymmetric, relevant, and timely risk/reward opportunities of our times.
This also speaks to the architecture of our primary reports: They are designed to serve as an intermediate-term foundation and extended framework for approaching each investment opportunity through time. This core feature drives the value proposition of the stoxdox – Portfolio Tool, as the reports are designed to have a long shelf life which we supplement with the snapdox reports.
One common error we are all susceptible to is selling too early after rapid gains. We have extended the high probability pricing structure for EOG into the future while alerting you to likely zones of resistance. Longer-term investors will find this of value as will shorter-term investors as the zones represent tradeable opportunities. The pricing structure is discussed below.
Excerpt: Zooming out to the 5-year weekly chart (below), the W pattern is visible as a large bottoming formation following a two-year bear market… The stock price is currently bouncing off the 50-week moving average (brown line on the weekly chart). This level should offer solid support going forward. A move above the 200-week moving average (grey line on the weekly chart) would signal that a breakout attempt above the $88 W top is unfolding. If this breakout is successful, next resistance stands at $100, followed by $115, then new all-time highs above $130…
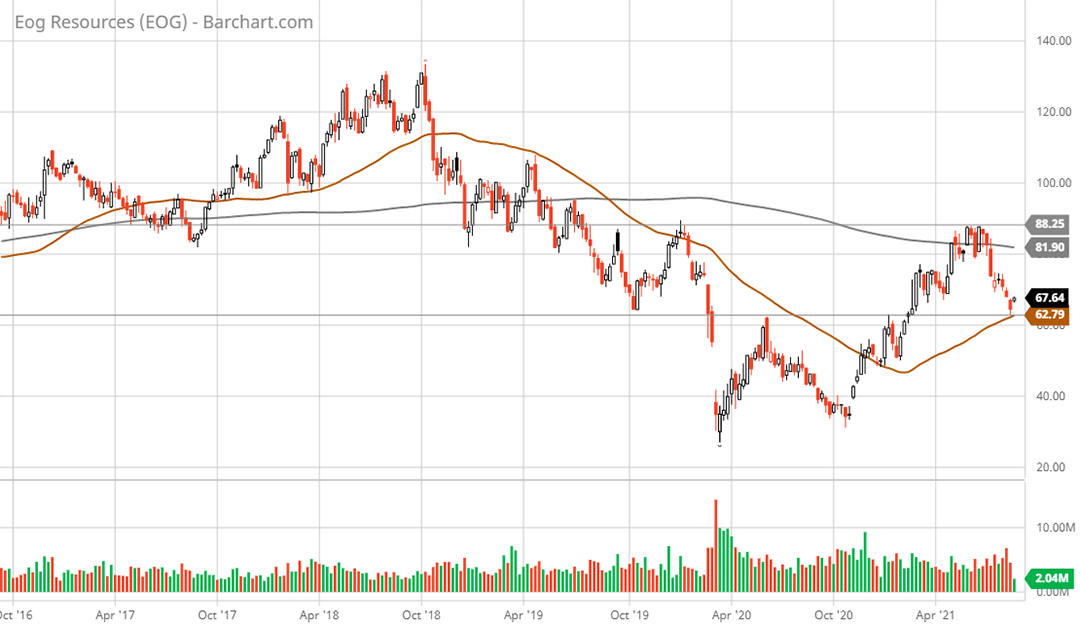
All told, the technical backdrop, like the excellent fundamentals and low valuation, suggests an enticing low-risk, high-reward setup for EOG investors.
Use Cases: We have designed our full suite of services, in addition to the primary reports, to offer members an incredible value proposition. This is a competitive advantage offered through the stoxdox platform. We empower members with a continual stream of opportunities, from current income through extraordinary growth companies, curating top opportunities for all market cycles.
The primary research reports and snapdox summary reports underpin the stoxdox – Portfolio Tool. It is designed to empower you by providing a continuous stream of actionable information across our entire research universe. Please let us know if you have any questions, it is an invaluable tool for maximizing your membership value.
You have the power.