I am reaffirming a positive risk/reward rating for Rio Tinto (NYSE: RIO) based on its unique portfolio diversification benefits, its leverage to secular growth trends, and its exceptionally asymmetric risk/reward profile. Rio’s investment case is bolstered by its top-tier copper growth potential, industry leading aluminum profitability, and arguably the world’s highest quality iron ore assets. The downside is reinforced by a nearby technical support base that has developed over the past 13 years, a discounted valuation, a 10% dividend yield, and a structurally bullish supply and demand balance for industrial metals over the coming decade.
Risk/Reward Rating: Positive
Bloomberg’s Joe Weisenthal recently covered the structurally bullish supply and demand balance for industrial metals. Weisenthal conducted an interview with Goldman Sach’s Nick Snowdon covering the topic of copper. Weisenthal’s Twitter commentary on the transcripts of the interview speaks volumes: “Why Copper Could Surge 10x Over The Next Decade” and “Absolutely worth your time, IMO, to understand this story, and the idea that copper will be the oil of the 2020s.”
While a 10x price increase for copper as well as it becoming the “new oil” are in the realm of possibility, it is important to weigh the source. Goldman Sachs is a sell-side investment bank that is in the business of raising capital for companies, including miners. That said, the above quotes capture the most likely directional trend for copper, and industrial metals more generally, looking out at the coming decade.
For a more comprehensive look at the global energy transition and its anticipated effect on various industrial metals, please see the “Global Growth Opportunity” and “Levered to Asian Demand” sections of my January Rio Tinto report. Please note that I structure these reports to serve as an extended framework and decision support tool for approaching each company through time. As a result, each report builds on prior work.
With that said, we appear to be entering exciting times for the materials sector, and the mining and metals industry in particular.
Diversification
I opened my January Rio Tinto report with the following passage which continues to capture the essence of the Rio Tinto investment case.
Rio Tinto is among the world’s leading producers of iron ore and aluminum and offers one of the highest copper growth profiles amongst its peers. As a result, the investment case for Rio Tinto hinges on the global supply of and demand for these critical industrial commodities as well as Rio Tinto’s competitive positioning.
A less appreciated aspect of the Rio Tinto investment case is the extraordinary portfolio diversification that Rio offers to most of today’s investors. We are all familiar with the increasing dominance of index funds in today’s markets. Additionally, it is now widely accepted amongst the investment community that the vast majority of active portfolio managers underperform their index. As a result, a large percentage of active managers engage in what is called “shadow indexing” to ensure that their performance does not deviate significantly from their benchmarks.
With the S&P 500 index serving as the barometer of “the stock market” for most professionals and the preferred investment vehicle for many, it is important to understand what “the market” is offering investors. The following table breaks down the sector weightings in the S&P 500 index using the holdings of the SPDR S&P 500 Trust ETF (NYSEARCA: SPY). The table below was compiled from State Street and details the sector exposure that the majority of today’s investors have in their portfolios.
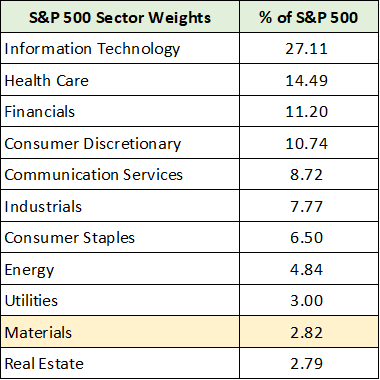
Source: State Street. Created by Brian Kapp, stoxdox
I have highlighted in yellow the materials sector weighting in the US stock market (Rio Tinto is in the materials sector but is not in the S&P 500). At only 2.82% of the market, it is safe to say that the majority of investors have little to no exposure to the materials sector.
If the secular growth trends in the coming decade rhyme with the initial quotes above, index investing is likely to underperform materially. The period following the 2000 tech bubble offers a glimpse into the possibility of poor index performance over a prolonged period of time. The S&P 500 did not surpass the 2000 peak until 2013.
Delving deeper into the materials sector, the exposure to the metals and mining industry (Rio Tinto’s subsector) is even more alarming from the perspective of diversification. The following table was compiled from State Street and lists each of the companies that comprise the materials sector in the S&P 500 index.

Source: State Street. Created by Brian Kapp, stoxdox
I have highlighted in yellow the two companies that are in the metals and mining subsector as well as their total weighting in the S&P 500. Index investors, and many of those invested in portfolios that benchmark to the S&P 500 and similar indices, have 0.3% exposure to what could become one of the greatest growth opportunities in the coming decade.
Additionally, the two similar companies, Freeport McMoRan (NYSE: FCX) and Newmont (NYSE: NEM), essentially offer exposure to copper and gold. As a result, Rio Tinto offers near perfect diversification for investors by providing material exposure to iron ore, aluminum, copper, gold, and soon lithium.
In summary, the majority of today’s investors can achieve a more efficient portfolio (the same or higher expected return with lower risk) by adding Rio Tinto. Rio Tinto is a perfect portfolio diversifier.
Copper: The New Oil
Going back to the Weisenthal quotes above and the likelihood of a secular bull market for copper, Rio Tinto has a world-class copper portfolio with peer-leading growth potential. This growth potential was on display in the first quarter when Rio offered to acquire the remaining shares of Turquoise Hill Resources (NYSE: TRQ) that it does not already own.
Rio Tinto currently owns just over 50% of Turquoise Hill Resources. If the offer is accepted, Rio would own 66% of the Oyu Tolgoi mine in partnership with the Mongolian government, which owns the remaining interest. Oyu Tolgoi is a tier-1 resource and is entering its most valuable phase of development with the commencement of the underground expansion. The underground mine, which holds much higher grades of copper and gold compared to the open pit mine, will bring Oyu Tolgoi to its planned production potential.
At peak stable production, Oyu Tolgoi is estimated to average 1 billion pounds of copper production per year through 2041, with the potential to extend the mine life for decades. I estimate Rio Tinto’s cash flow potential at this level of production could range from $2 billion to $3.6 billion per year if copper prices are in the $4 to $6 range. This range represents a copper price change from today’s price of between -7% to +40%. I view this as a fairly modest estimation of the potential for copper over the coming decade.
A more bullish scenario could develop due to a structurally tight supply condition resulting from the energy transition. If this becomes the case, cash flows would explode from my estimated $2 billion to $3.6 billion per year at $4 to $6 copper. Please note that my cash flow estimate incorporates 330,000 ounces of gold production per year and Rio Tinto’s 66% ownership of the Oyu Tolgoi mine.
For a review of the bullish case for copper, I would suggest “The Revenge of the Miners” presentation by Robert Friedland, the Executive Co-Chairman of Ivanhoe Mines (OTCQX: IVPAF). In his more recent presentation in Riyadh, Saudi Arabia, Friedland estimated that the mining industry needs to invest an additional $240 billion over the next five years just to meet demand.
For reference, Rio is offering $2.7 billion for half of the cash flow estimated above, which amounts to one third of Oyu Tolgoi’s estimated 1 billion pounds of copper production per year. The valuation at which Rio Tinto is acquiring the remaining Turquoise Hill Resources interest is summarized in the table below. The capital structure information was compiled from Seeking Alpha. I have added my cash flow and valuation estimates in the lower portion of the table.
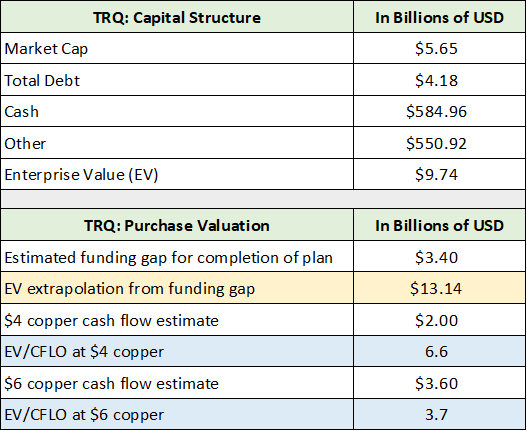
Source: Seeking Alpha. Created by Brian Kapp, stoxdox
Rio is essentially acquiring 330 million pounds of planned and established copper production and 110,000 ounces of gold production per year for $2.7 billion. This looks to be an exceptional capital allocation choice. A new mine of this magnitude would require a considerably higher level of capital investment, a much longer time frame, and the extraordinary risks that are associated with all new mine developments.
Copper Portfolio
In fact, Rio Tinto has created a formidable copper portfolio of world class assets. For example, Rio Tinto owns a 30% interest in the world’s largest copper mine, Escondida in Chile. Rio Tinto owns 55% of the Resolution Copper mine in Arizona which, if brought online, could produce 25% of the United States’ annual copper demand for forty years. As discussed above, Rio is set to own 66% of the Oyu Tolgoi mine, which is slated to become the world’s fourth largest copper mine. Finally, the company owns the Kennecott copper mine in Utah, which is the world’s deepest open pit mine and has produced since 1906. This mine has been upgraded for at least another decade of production.
The following table summarizes Rio Tinto’s potential copper production. This production looks to be achievable in the mid to second half of the current decade and represents 118% growth compared to Rio’s 2021 copper production. The data was compiled from Rio Tinto’s 2020 and 2021 annual reports and the most recent Turquoise Hill Resources Q4 2021 investor presentation and are solely my estimates based on the available information.
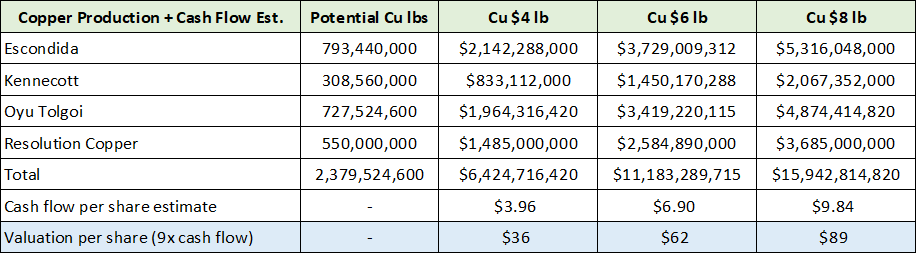
Created by Brian Kapp, stoxdox
I have highlighted in blue my valuation estimates of Rio Tinto’s current copper potential in the mid-decade time frame, which the market should progressively price into Rio’s shares. The estimate range is $36 to $89 per Rio Tinto share, with $36 to $62 being the most likely scenario several years out. Please note that these per share valuation estimates only reflect Rio’s copper portfolio. With Rio Tinto trading near $74 per share, and copper comprising only 12% of Rio’s current business, the copper analysis suggests that Rio Tinto’s shares have material upside potential.
The 9x cash flow multiple is derived from Freeport McMoRan’s current enterprise value to cash flow valuation using its trailing 2021 cash flow. Freeport represents a copper bellwether. I assume Rio Tinto’s copper portfolio cash cost to be $1.30 per pound, which is currently in line with a broad spectrum of copper producers with similar high-quality assets (including Freeport McMoRan and Ivanhoe Mines).
Copper Forecast
In the short term, copper supply looks likely to exceed demand as a result of the global economic slowdown coinciding with new production coming online and production recoveries following the COVID disruptions. That being said, copper inventories are currently near 16-year lows.
With the increasing importance of copper to the unfolding energy transition (see “Global Growth Opportunity” in my last report), it would be rational for industry and government participants to restock inventory of a mission critical commodity at the earliest opportunity. As a result, the price of copper is likely to be well-supported near current levels, with the caveat that downside volatility could materialize if a global recession takes hold. Regardless, the view through the coming decade looks quite bullish for copper. The following table from my January report provides recent industry copper price forecasts per year.
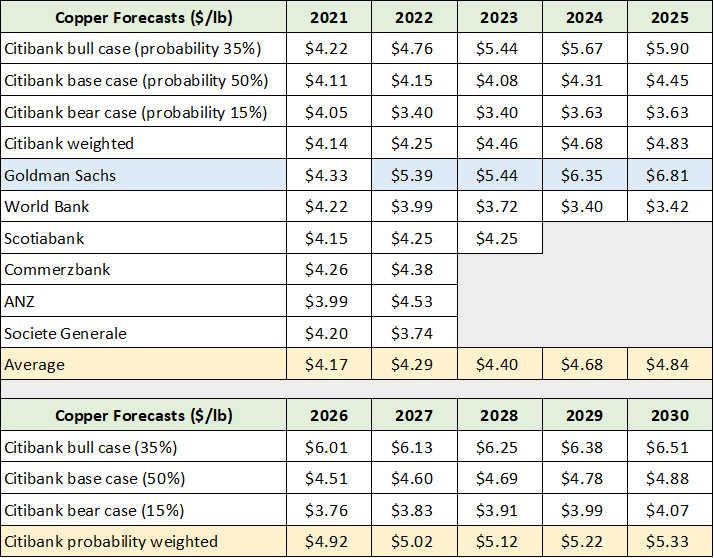
Created by Brian Kapp, stoxdox
I have highlighted in blue Goldman Sach’s forecast as I view the price estimates for 2024 and 2025 to be in line with the onset of likely supply shortfalls coming into view. The yellow highlighted cells represent average estimates which are generally near the midpoint of my $4 to $6 dollar range used above.
Copper Technicals
Taking a step back, the following 20-year monthly copper chart places the price estimates above into proper context. Notice that the price of copper recently broke out to a new all-time high near $5 before being quickly rejected. The upper orange line denotes the primary resistance level while the lower orange line represents the nearest support level ($3.90 to $4.50). The two green lines represent what should be an extraordinarily strong support zone ($2.80 to $3.30).
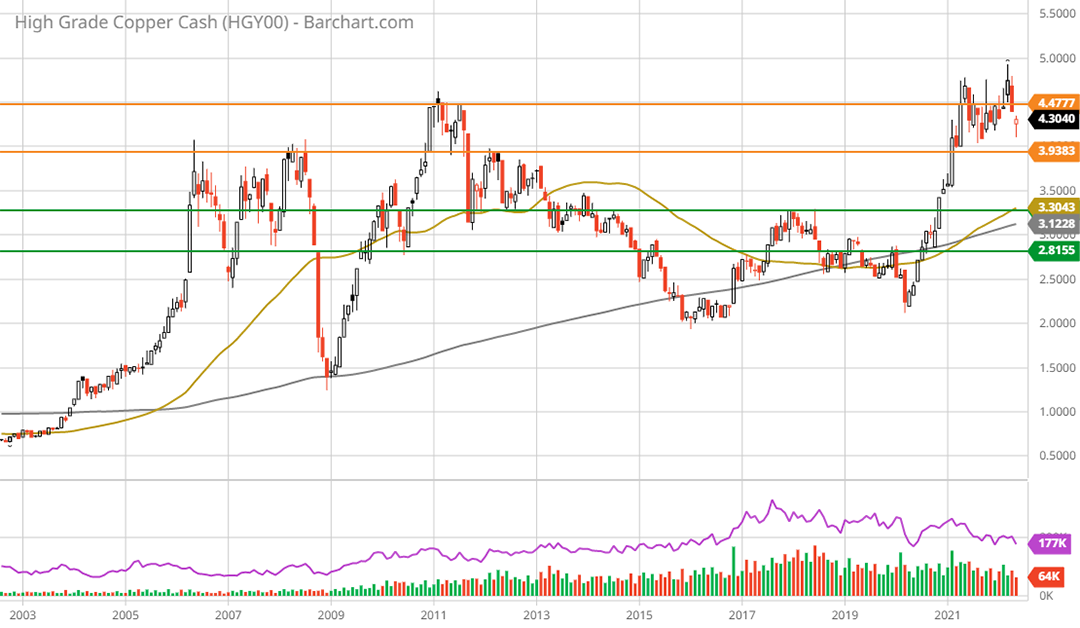
Copper 20-year monthly chart. Created by Brian Kapp using a chart from Barchart.com
In my estimation, the area between $3.50 and $4 should offer strong support. Additionally, this zone could be tested in the near term due to the aforementioned supply coming online. A recent Seeking Alpha article by Carl Surran, SA News Editor, “Global copper supply seen outpacing demand next year, RBC says,” summarizes the near-term copper setup quite well. The following quote captures RBC’s forecast from the article:
RBC forecasts copper’s price averaging $4.32/lb in 2022 and falling to $3.75/lb in 2023 and 2024 on a “small” surplus in the market.
The key phrase in the above quote is “small surplus.” Copper is a global commodity and the price is set at the margin. The mining industry is notorious for production disruptions due to all manner of natural and recurring events such as equipment failures, labor strikes, and natural disasters.
As a result, a “small surplus” can become a material deficit if production becomes interrupted. The lack of margin for error is made more acute by copper inventories being near 16-year lows. The following 5-year weekly chart provides a closer look at the recent copper trend.
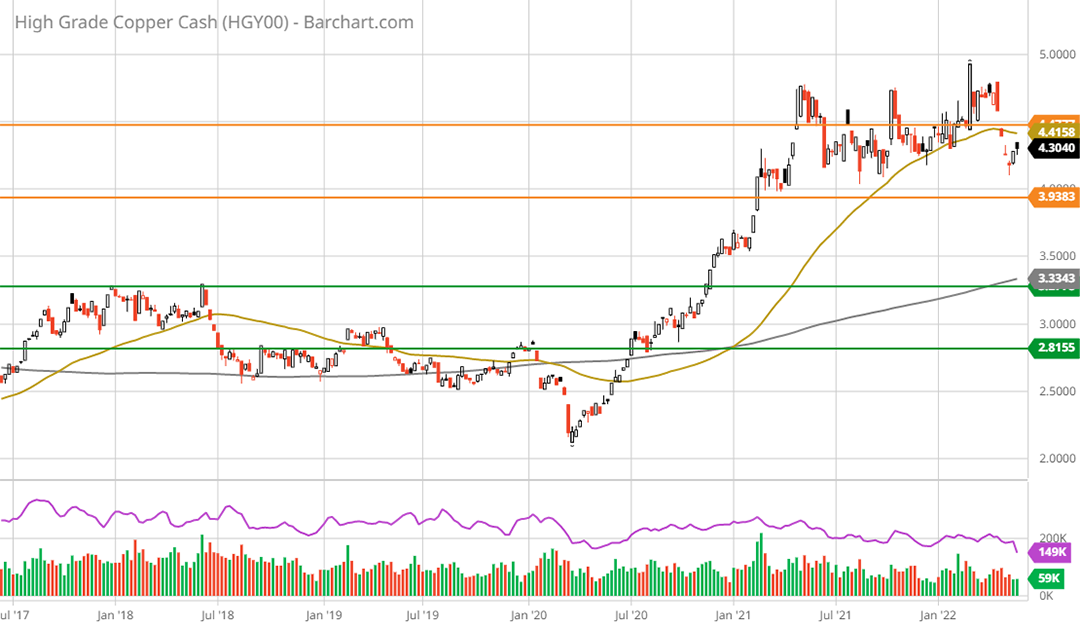
Copper 5-year weekly chart. Created by Brian Kapp using a chart from Barchart.com
While copper is technically extended to the upside compared to the COVID price weakness in the first half of 2020, this upside extension has been consolidating sideways for nearly a year. As a result, copper is not technically overextended on a 1-year time frame. Nonetheless, investors should be prepared for a possible test of the $3.50 to $3.90 range. If this were to occur, it would likely create material downside volatility for copper stocks and represent an excellent entry point for investors looking to accumulate shares.
The possibility of a near-term copper correction and the associated volatility this would create for copper stocks, further highlights a core pillar of the Rio Tinto investment case, diversification. While a copper bellwether like Freeport McMoRan would likely selloff materially in a near-term copper correction, Rio Tinto’s shares should experience much less volatility as copper represents only 12% of its current business. The copper case for Rio Tinto is all about its future growth plans which are well aligned with the potential for supply shortfalls toward mid-decade.
Aluminum
The aluminum market is also undergoing a structurally bullish transition due to the demand for “light weighting” to reduce energy consumption throughout the global economy. However, the most important and bullish structural shift is emanating from China. China has halted aluminum capacity growth, which has been stagnant since 2017 as can be seen in the slide below from my prior report. This seismic shift is creating a more economically robust supply dynamic for the global aluminum market and is likely to support higher prices over the intermediate to longer term.
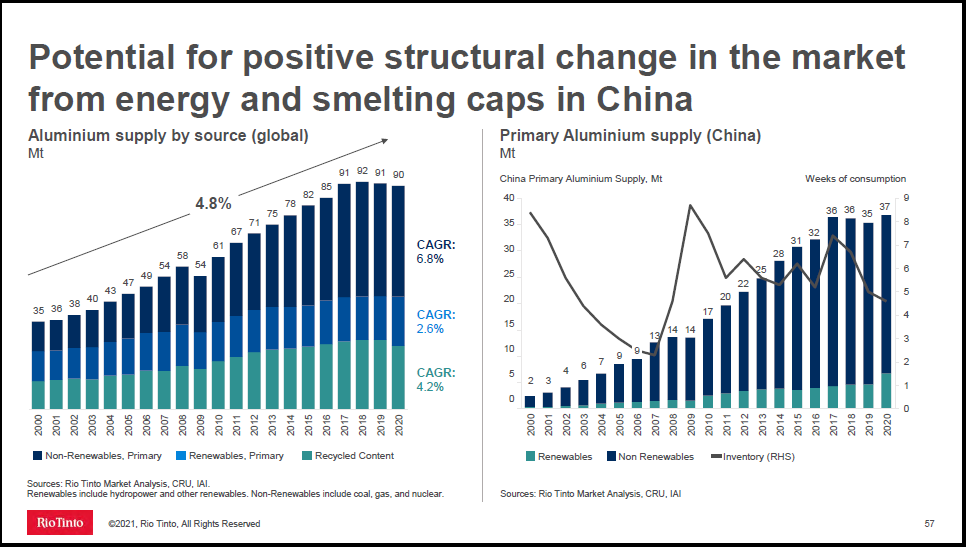
Source: Rio Tinto’s October 2021 Investor Seminar
Aluminum is one of the most carbon-intensive metals to produce. Given that the majority of China’s aluminum supply is powered by burning coal, it is highly likely that this structural supply constraint will remain in place given China’s emission target commitments and global trade disputes.
Rio Tinto operates one of the most efficient aluminum businesses in the world from a carbon footprint perspective. With carbon prices skyrocketing and carbon increasingly becoming a cost, Rio Tinto has a competitive cost advantage. 60% of the global aluminum industry is powered by coal. As the cost of these coal operations continues to increase, it will place upward pressure on aluminum prices. Rio Tinto should experience substantially higher profit margins as a result.
Aluminum: Profitability
In fact, from a profitability perspective, Rio Tinto is an industry leader, which can be seen in the slide below from my prior Rio report.
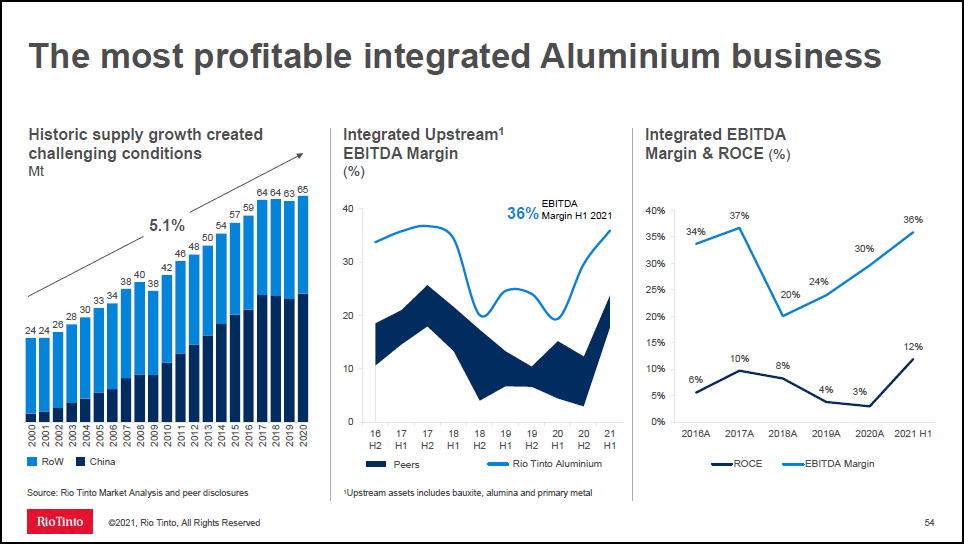
Source: Rio Tinto’s October 2021 Investor Seminar
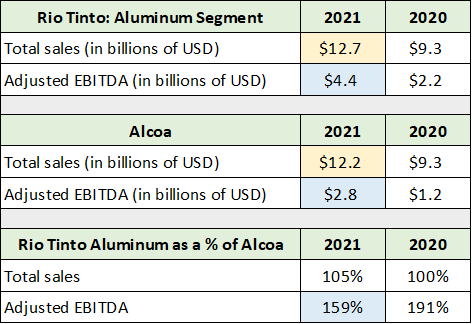
Like Freeport McMoRan in the copper industry, Alcoa (NYSE: AA) is a bellwether in the aluminum industry and serves as an excellent comparable company for Rio Tinto’s aluminum business. Additionally, Alcoa’s and Rio Tinto’s aluminum businesses are roughly the same size from a revenue perspective.
The table below summarizes Rio Tinto’s 2021 and 2020 aluminum results and compares them to those of Alcoa. The data was compiled from the Rio Tinto company reports used thus far and Alcoa’s 2021 10-K filed with the SEC. I have highlighted in yellow the sales figures for each company, which are nearly identical. The key differentiator of Rio Tinto’s aluminum business, profitability, is highlighted in blue for ease of comparison.
Created by Brian Kapp, stoxdox
Rio Tinto’s aluminum business produced an incredible 159% of Alcoa’s EBITDA on nearly identical sales in 2021, and nearly twice as much in 2020. It is clear that Rio Tinto’s aluminum business deserves a substantial valuation premium compared to Alcoa, and the industry as a whole.
Aluminum: Valuation Premium
Rio Tinto’s valuation premium extends beyond its superior profitability. On the cost of capital front, Rio’s long-term credit rating is in solid investment grade territory (S&P Global Ratings: A, Moody’s: A2) while its short-term credit ratings are the highest possible. In comparison, Alcoa’s long-term credit rating was just recently upgraded to one notch above junk by Fitch (BBB-). S&P Global Ratings continues to have a junk credit rating on Alcoa (BB+), however, the outlook for an upgrade is positive.
This is important because Rio Tinto has a much lower cost of debt capital compared to Alcoa. On the equity side, Rio Tinto has a 5-year beta of 0.59 compared to Alcoa’s 2.34. Essentially, Rio Tinto’s equity is roughly half as volatile as the overall equity market. In comparison, Alcoa’s equity is roughly 2.34x more volatile than the overall equity market. Using beta as a gauge of equity risk, Rio Tinto’s cost of equity capital should remain well below that of Alcoa’s.
When discounting the cash flows of each business, the lower discount rate applied to Rio Tinto’s aluminum business compared to that of Alcoa amplifies the valuation premium emanating from Rio’s materially higher profitability.
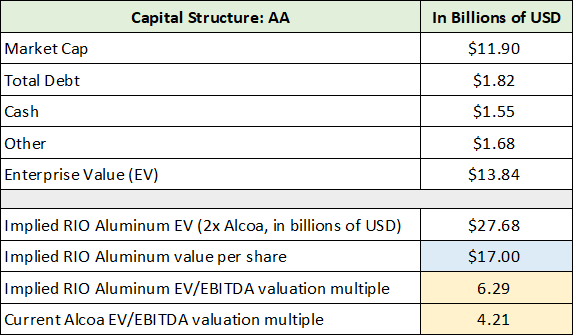
In the following table, I approximate the premium using a discounted cash flow framework. I incorporate the assumption that Rio Tinto’s total cost of capital is 33% less than that of Alcoa’s and that its annual cash flow remains 60% higher than Alcoa’s. Under these assumptions, Rio Tinto’s valuation is roughly 2x that of Alcoa’s. Alcoa’s current valuation is summarized in the table below. The capital structure information was compiled from Seeking Alpha.
Source: Seeking Alpha. Created by Brian Kapp, stoxdox
I have highlighted in blue the estimated value per share of Rio’s aluminum business using this comparable approach. The yellow highlighted cells compare the resulting valuation multiple of Rio’s aluminum business to that of Alcoa’s. I view Rio Tinto’s premium aluminum valuation of 6.29x EBITDA as very reasonable in relation to Alcoa’s 4.21x valuation.
Aluminum + Copper Valuation
If we add the $17 per share estimate for the aluminum business to the range of copper valuations from above, the resulting valuation of Rio’s two smaller business segments can be estimated. Please note that aluminum accounted for 19% of total sales in 2021 while copper comprised 12% of sales. The valuation estimates per share under the three copper scenarios above (including the aluminum estimate) is as follows: $53, $79, and $106.
Iron Ore
The copper and aluminum businesses are relatively small for Rio Tinto compared to its iron ore business. I began with the smaller segments to illuminate the value proposition of Rio Tinto’s shares at $74. Additionally, I covered the iron ore business in more detail in my prior report in the “Iron Ore: Core Business” section. I highly recommend reading the report as it compliments this analysis.
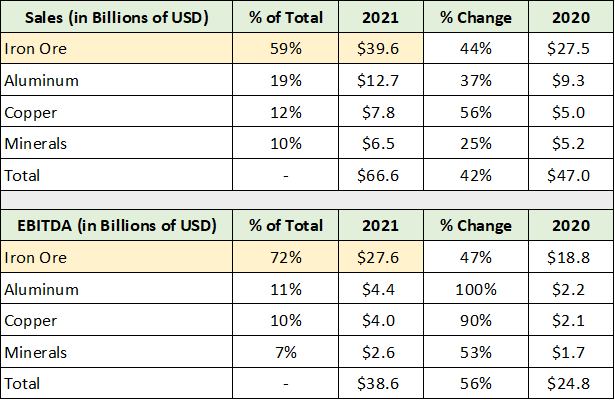
The following table displays the performance of each of Rio Tinto’s businesses in 2021 and 2020. It was compiled from the company reports used thus far. I have highlighted in yellow the performance of the iron ore business to highlight the scale of the operation.
Created by Brian Kapp, stoxdox
In recent years, the price of iron ore has skyrocketed which has translated into incredible cash flow for Rio Tinto. In 2021 alone, using EBITDA as a cash flow proxy, the iron ore business generated nearly $28 billion. With a current enterprise value of $124 billion, Rio Tinto is valued at 4.5x its iron ore EBITDA alone and 3.2x its total 2021 EBITDA.
The reason for the incredibly low valuation is that the market expects iron ore prices to trend toward the mid-$80 per tonne range in the coming years. This compares to an average price of roughly $147 in 2021, and $103 in 2020. The following table summarizes the industry iron ore price estimates from the January Rio report.
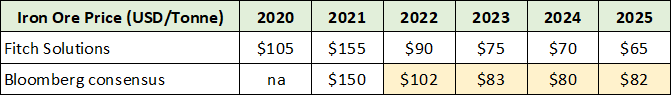
Source: mining.com
I have highlighted in yellow the central forecast tendency towards $85 over the coming years. This price trajectory for iron ore suggests that we ignore the exceptional 2021 iron ore results in estimating the sustainable performance level of the iron ore business.
The central forecast tendency toward the mid-$80 range through 2025 looks like an appropriate baseline expectation going forward. This price estimate was the top end of the iron ore trading range between 2016 and 2020, preceding the recent price spike. This is likely to be a strong support zone for iron ore.
As a result, Rio Tinto’s iron ore performance in the 2018 to 2020 period offers a high confidence estimate of sustainable iron ore earnings. The following table was compiled from Rio Tinto’s 2020 annual report. It details Rio Tinto’s iron ore earnings between 2018 and 2020 and the associated iron ore price. The lower two rows summarize several per share valuation estimates for the iron ore business.
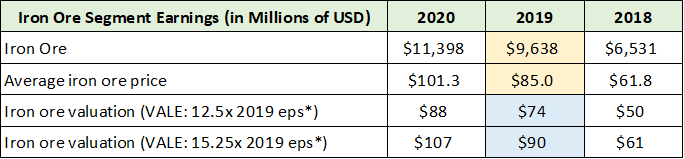
Created by Brian Kapp, stoxdox
I have highlighted in yellow Rio Tinto’s 2019 iron ore results. The $9.6 billion of iron ore earnings in 2019 at an average iron ore price of $85 is an excellent sustainable earnings profile given the price forecast. Using this consensus baseline price for iron ore allows for upside surprises emanating from the global energy transition and the various Belt and Road type initiatives which were discussed in my prior report.
Iron Ore: Valuation
I selected Vale S.A. (NYSE: VALE), a leading iron ore producer, for a relative valuation approach for Rio Tinto’s iron ore operations. The iron ore production profile for each company is nearly identical. Vale is currently valued at 15.25x its 2019 normalized earnings estimate, assuming a 30% tax rate similar to Rio Tinto’s. This approach places a $90 per share valuation on Rio Tinto’s iron ore business (highlighted in blue in the above table). At the time of my last report, Vale was valued at 12.5x normalized 2019 earnings, which implied a $74 per share valuation for Rio’s iron ore business.
Please note that Rio Tinto’s iron ore operations carry substantially lower ecological and social risk than Vale’s operations. Vale’s primary mine assets are located in ecologically sensitive regions in Brazil, as evidenced by its two major tailings dam failures in 2015 and 2019. As a result, I view the comparable Vale valuation approach as a conservative estimate for the value of Rio Tinto’s operations in the Pilbara region of Australia.
Potential Return Spectrum
Nonetheless, Rio Tinto is trading in the $74 range today. The $74 to $90 valuation estimate for the iron business accounts for much, if not all of Rio Tinto’s current valuation. Recall that the range of estimates for the copper and aluminum businesses was $53, $79, and $106 when looking out several years.
Finally, Rio Tinto produced $2.6 billion of EBITDA in its minerals segment in 2021, for which I have not estimated a per share valuation. I apply a 4.4x EV/EBITDA, which is BHP Group’s (NYSE: BHP) current valuation. Thus, the minerals business adds $7 per share to Rio Tinto’s valuation estimate.
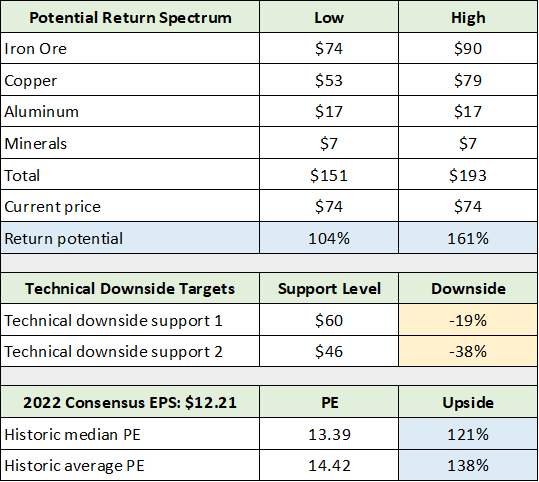
The following table summarizes the potential return spectrum based on the valuation estimates herein. I added technical targets to estimate the potential downside. The lower section provides additional upside targets using Rio’s historical average and median PE applied to the 2022 consensus earnings estimate.
Created by Brian Kapp, stoxdox
I have highlighted in blue the upside return potential and in yellow the downside estimates. The upside return potential is +104% to +161%. This appears to be well-supported by fundamentals looking out to mid-decade. I view the -38% technical downside potential as highly unlikely given the healthy outlook for industrial metals and Rio Tinto’s discounted valuation. The -19% return potential is the most likely near-term downside scenario in my view.
Please keep in mind that Rio Tinto pays a large dividend. The base dividend for 2021 equates to a 10%+ yield at today’s price. This is a substantial return in its own right and is additive to the above estimates. Given the enormity of the dividend payment, it is highly likely that Rio has maxed out its payout capacity for the foreseeable future. Regardless of the short-term payout policy, Rio should remain a top income producing stock.
Lithium
Before a brief technical overview and concluding remarks, it is important to note that Rio Tinto is pursuing substantial growth opportunities in lithium mining.
Lithium prices are skyrocketing as the automobile industry ramps up EV production. For example, Sociedad Quimica y Minera de Chile S.A. (NYSE: SQM) reported that lithium prices grew by 576% in Q1 2022 compared to Q1 2021.
Lithium is an excellent example of global commodity production capacity being stressed by the energy transition and tight supply conditions. It also illuminates the very real possibilities for other metals in a commodity bull market, as was suggested by the opening Weisenthal quotes.
Rio Tinto has two large projects in the pipeline which are each capable of producing roughly 50,000 tonnes of battery-grade lithium per year. One project is moving forward while one is on pause and is being reevaluated by the Serbian government. The bottom line, lithium is an exceptional growth opportunity and Rio Tinto’s actions suggest that it intends to become a leading market participant. Rio Tinto has excellent growth prospects in the unfolding energy transition.
Technicals
Rio Tinto’s technical backdrop is one of incredibly strong long-term support combined with little in the way of visible resistance. The strong support zone is highlighted by the green and blue horizontal lines on the 20-year monthly chart below.
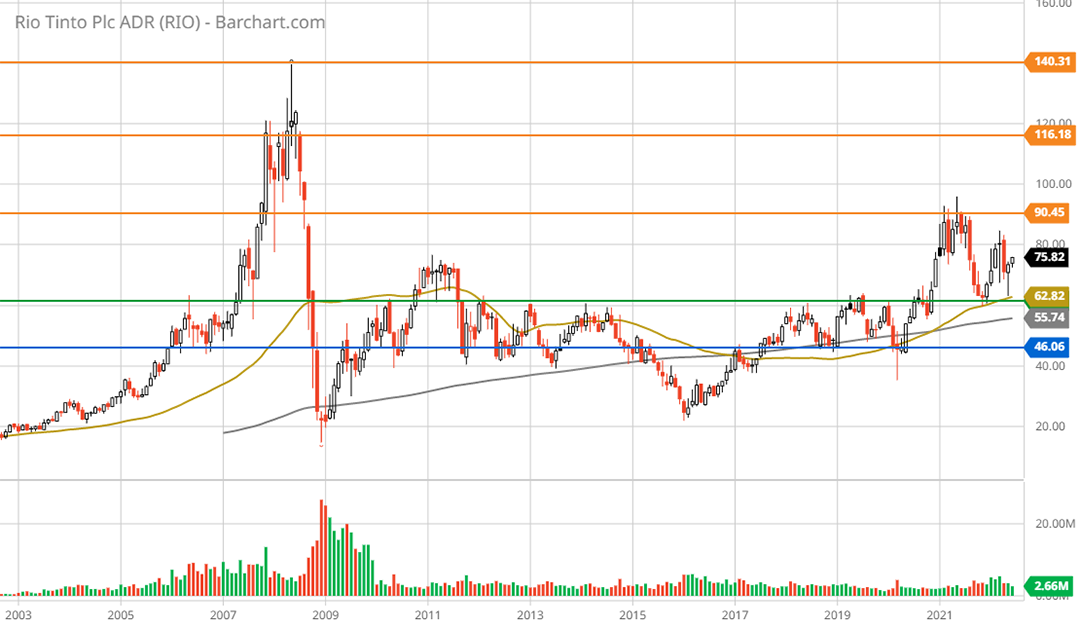
Rio Tinto 20-year monthly chart. Created by Brian Kapp using a chart from Barchart.com
The 13-year inverse head and shoulders pattern suggests a bottom formation of significant importance. Given the length of time involved in establishing this foundation, incredibly strong support near the green line at $60 is the most likely scenario on the downside. This represent -19% downside potential from current levels and is in the realm of possibilities given short-term dynamics.
Upside resistance levels are highlighted by the orange horizontal lines. The return potential to each level is as follows: 22% ($90), 57% ($116), and 89% ($140). Importantly, there has been no trading above $90 since the 2008-time frame. As a result, the amount of expected resistance on the upside is minimal. Zooming into the 5-year weekly chart below, things begin to look more bullish technically.
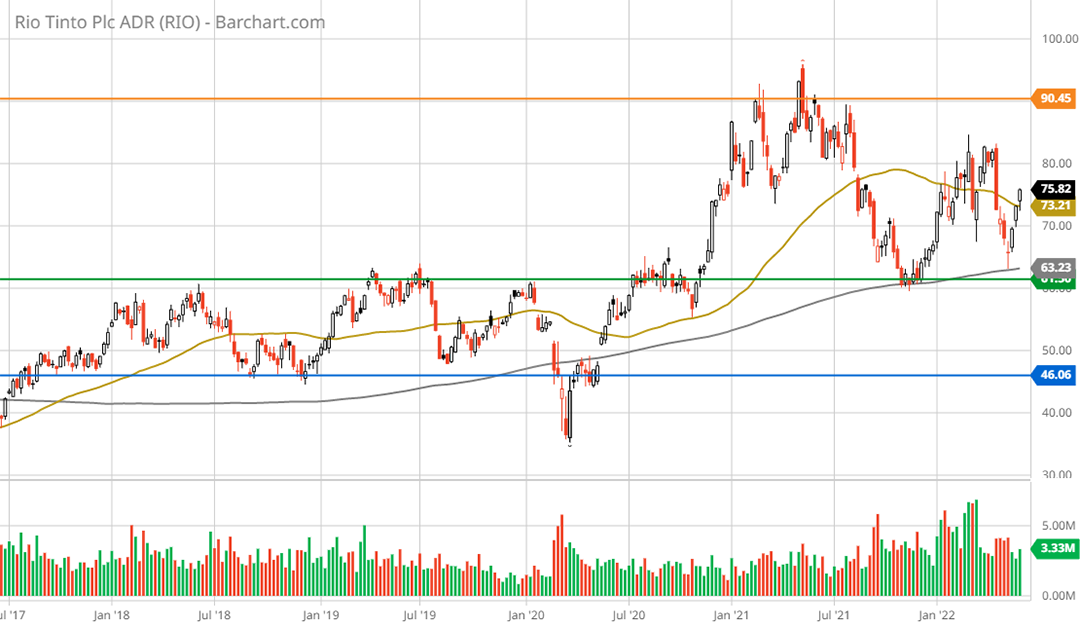
Rio Tinto 5-year weekly chart. Created by Brian Kapp using a chart from Barchart.com
Rio Tinto has clearly broken out of the sideways consolidation pattern and is rallying strongly off long-term support levels. The lack of technical overextension combined with little visible resistance, as well as strong support nearby, creates a technically asymmetric risk/reward opportunity.
Summary
With what looks to be a solid support base near $60, Rio Tinto offers an incredibly asymmetric risk/reward profile considering its 104% to 161% fundamental upside potential and current 10%+ dividend yield. The coming global infrastructure and energy transition boom is highly likely to support robust industrial metals markets over the coming decade. Rio Tinto is a best of breed blue chip sitting on the cusp of a historic growth cycle while offering perfect diversification for all portfolios.
Price as of report: $74
Rio Tinto Investor Relations Website: Rio Tinto Investor Relations