
I am assigning Palantir Technologies (NYSE:PLTR) a neutral risk/reward rating as the long-term growth opportunity is counterbalanced by near-term red flags. The long-term opportunity lies in becoming a foundational enterprise operating system capable of integrating structured and unstructured data for real-time intelligence. However, a number of notable red flags warrant caution. The primary red flags include slowing sales, an unusual go-to-market shift, rapidly decelerating profitability, and an elevated valuation which offers limited margin for error.
Risk/Reward Rating: Neutral
Palantir has an unusual business model compared to its peers in the enterprise software sector in regard to how it acquires and grows its customer base. The company categorizes its customers according to three phases of development or cohorts: (1) Acquire, (2) Expand, and (3) Scale. While they are generic terms that are applicable to all businesses, they are unique in the case of Palantir due to how the company approaches its customers.
Customer Detail
Palantir defines a customer in the Acquire cohort as one that has generated less than $100,000 of revenue as of year-end while being unprofitable to Palantir. The Expand cohort is characterized by a customer that generated more than $100,000 of sales yet remained unprofitable. Finally, the Scale cohort is defined as a customer that has generated more than $100,000 of revenue while being a profitable relationship for Palantir during the year.
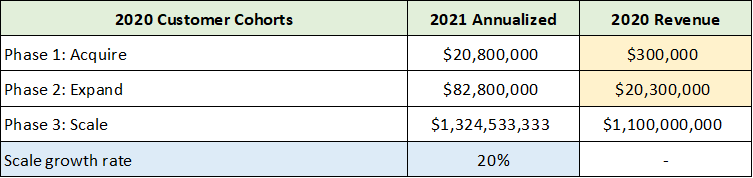
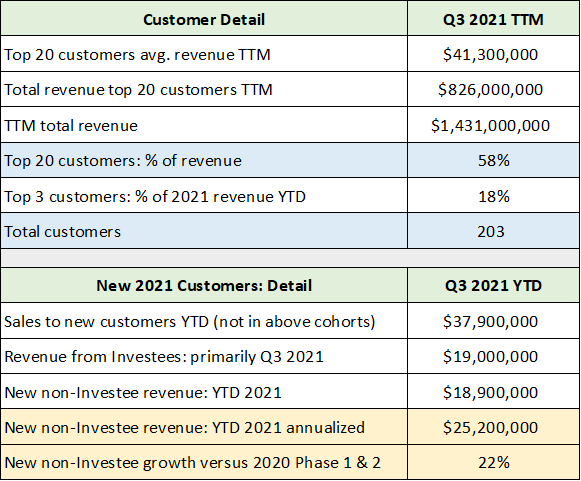
The following tables were compiled from Palantir’s Q3 2021 10-Q filed with the SEC. The first table displays Palantir’s 2020 sales from each of the client cohorts which were categorized at the end of 2020 (2020 Revenue). In the 2021 Annualized column, you will find the sales of each of these 2020 customer cohorts through Q3 2021 annualized. In the second set of tables, I have compiled key details regarding Palantir’s largest customers over the past twelve months, as well as critical details pertaining to customers that are new to Palantir in 2021 which are not yet assigned to a cohort. Cohort categorization occurs at the end of each year.
Source: Created by Brian Kapp, stoxdox
For ease of comparison, I have color-coded the information that is related. One of the dominant realities for Palantir is its concentrated customer base, which is highlighted in blue. Palantir has only 203 customers, with the top 20 accounting for 58% of sales.
By definition, Palantir’s largest customers are in the Scale cohort. Through the first three quarters of 2021, the Scale cohort (categorized as such at the end of 2020) is growing at an annualized rate of 20%. Given that this group accounts for 86% of Palantir’s revenue, it will be challenging to move the sales growth needle materially above 20% without explosive growth from the other two cohorts or a material acceleration from the Scale cohort. It should be noted that management is guiding to 30% annual sales growth through mid-decade.
The 2020 year-end Acquire and Expand cohorts are highlighted in yellow in the upper table. New customers in 2021 will not be assigned to a cohort until the year-end Palantir report. I have highlighted the pertinent 2021 new customer data in yellow for easy comparison to the 2020 Acquire and Expand customer cohorts. I view the 2021 new customer sales performance excluding sales to Investees to be a sustainable core growth rate. The Investee customer acquisition strategy is extraordinarily unusual and carries an exceedingly high capital risk which introduces reputational and, therefore, brand risk.
Please note that Investee here refers to customers that Palantir has purchased the stock of in return for the Investee using Palantir’s software. Meaning, the revenue from Investees is a reciprocation of Palantir investing in the shares of these customers. In this respect, these are not arm’s-length transactions. I believe the new client numbers excluding sales to Investees is an important data point for ascertaining a purely market-based new customer growth rate.
Similar to the Scale cohort growth rate annualizing at 20% in 2021, the new customer sales growth rate is annualizing at 22% through Q3 2021 compared to the $20.6 million of sales from the Acquire and Expand cohorts of 2020. While this is not a perfect comparison for sales growth from new customers, it is a fair estimation. As a result, Palantir appears to be trending toward an underlying sales growth rate closer to 20% than the company’s 30% sales growth guidance through mid-decade.
Investees
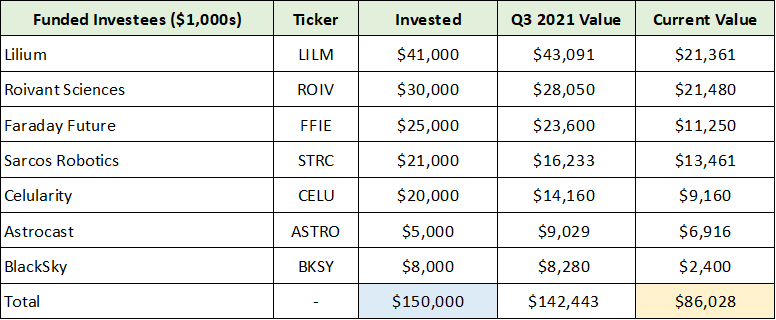
It is important to step back and review Palantir’s investments in Investees as this is an extraordinarily unusual go-to-market strategy for customer acquisition. The above numbers, which suggest revenue growth is trending toward 20%, place Palantir’s use of its balance sheet cash to fund new customers in a new light. The following tables were compiled from Palantir’s Q3 2021 10-Q. The first table lists companies that Palantir has funded as of the end of Q3 2021. The second table displays Palantir’s investment commitments to new companies that are not yet funded.
Source: Created by Brian Kapp, stoxdox
I have conducted a cursory review of each of the above companies. The common theme is that they are all early-stage companies in the most popular growth sectors. These sectors include EVs, robotics, flying electric vehicles, satellite services and drug discovery. None of the Investees appears to offer enough appreciation potential in its own right to move the needle materially for Palantir’s valuation. Palantir’s ownership stake ranges from 0.4% to 1.6%.
It remains unclear how much of each company’s funding can be spent on Palantir’s software. Furthermore, it is not clear if the $19 million of revenue through Q3 2021 from these companies is sustainable.
I have highlighted in blue Palantir’s total investment of $150 million in the seven companies. The yellow highlighted cell represents the current valuation of the investments. Palantir is now down approximately $64 million on these seven companies alone. This highlights an extreme risk for this method of customer acquisition as the capital losses to date dwarf the revenue generated. There are other private company investments not listed above, however, Palantir does not break out the details. They are included in other assets on Palantir’s balance sheet which amounted to $116 million as of Q3 2021.
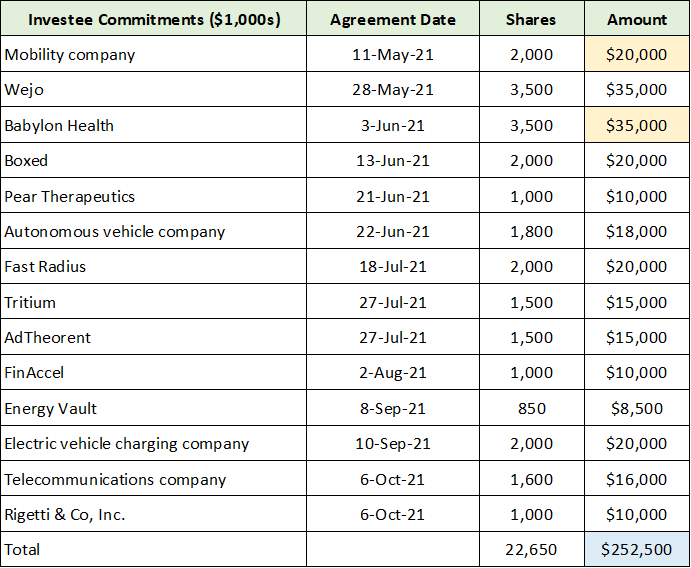
The following table displays Palantir’s commitments to invest in new companies as of Q3 2021. I have highlighted in yellow the two companies that Palantir funded subsequent to the end of Q3 2021.
Source: Created by Brian Kapp, stoxdox
I have highlighted in blue the total funding commitment for new investments as of Q3 2021. This is $252 million on top of the $150 million completed prior to the end of Q3. While I have not looked into these particular companies, they appear similar to the first seven investments reviewed above. Meaning, they appear to carry extreme capital risk with upside potential that is likely to be minimal when compared to the valuation upside inherent in Palantir’s software business. It should be noted that recent valuations were extreme and continue to contract rapidly. As a result, the timing risk for capital loss is also heightened by making the investments at the top of the VC/IPO cycle.
Financial Performance
Turning to Palantir’s recent performance, I have chosen to view sales growth excluding the Investees as this is the most likely sustainable growth trajectory. The following table was compiled from Palantir’s Q3 2021 10-Q filed with the SEC. I made an adjustment by removing Investee revenue to arrive at a net revenue figure.
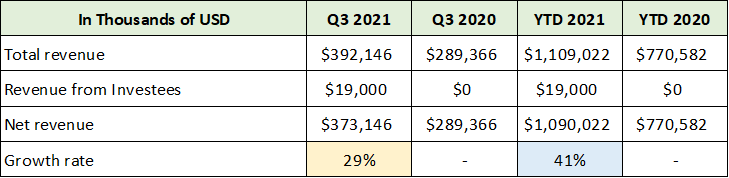
Source: Created by Brian Kapp, stoxdox
I have highlighted in yellow the 29% revenue growth in Q3 2021 after removing the Investee revenue. Investees added 6.5% to growth in Q3. Year-to-date, the Investee revenue accounted for 1.7% revenue growth. The 29% growth rate is already decelerating beneath the company’s 30% growth guidance through mid-decade. Keep in mind that the Investee revenue stream will grow with additional funding of Palantir’s investment commitments. Regardless, growth is decelerating rapidly at 29% in Q3 compared to 41% year-to-date excluding these non-arm’s-length sales.
Geographic & Segment Sales
The sales slowdown is being led by France, which contracted 22% through the first three quarters of 2021 (highlighted in orange below). It should be noted that Palantir has had a material relationship with Airbus and the airline industry. This could be a negative read through for an important client and industry. While the US remained the best performer in Q3 2021, growth is slowing rapidly as is evidenced by the blue highlighted cells below. The table was compiled from Palantir’s Q3 2021 10-Q filed with the SEC.
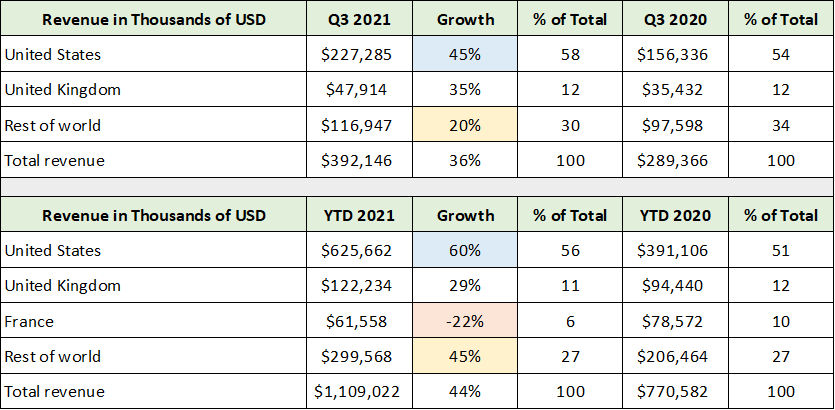
Source: Created by Brian Kapp, stoxdox
In addition to France, the rest of the world is also slowing rapidly, from 45% through the first nine months of the year to 20% in Q3 2021. Please note that these are reported sales without any adjustments. The following table was compiled from the same SEC filing and highlights that the large sales slowdown in Q3 occurred in the Government segment. Please keep in mind that the Investee revenue is included in the figures below and added approximately 6.5% to the Q3 growth rate in the Commercial segment.
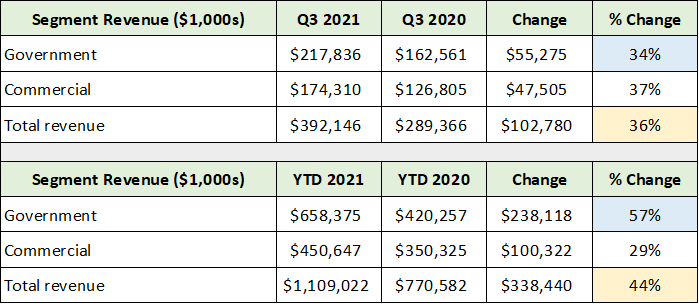
Source: Created by Brian Kapp, stoxdox
In summary, the Commercial segment is growing revenue rather steadily, approximately 29% excluding the Investee revenue. However, the Government segment is decelerating rapidly, from 57% through the first nine months of 2021 to 34% in Q3.
Gross Profit & KPI
Palantir’s unusual customer acquisition strategy predates the shift to Investees. The company’s sales and marketing expenses appear to be quite similar to the cost of goods sold for other companies. This is the case because Palantir offers prospective customers free pilot programs as opposed to requiring payment upfront for use of its software. Sales and marketing personnel execute the pilot programs and coordinate solution development in order to generate sales. The following quote from the Q3 2021 10-Q summarizes the situation:
Sales and marketing costs primarily include salaries, stock-based compensation expense, and benefits for our sales force and personnel involved in executing on pilots and customer growth activities…
As a result, I view the sales and marketing expense in the case of Palantir to be a cost of goods sold and reduction to gross margin. While this categorization does not affect the bottom line, it does serve to place the reported 78% gross margin in context.
I believe this perspective on sales and marketing expense is helpful in thinking about Palantir’s business model in relation to other companies and relative valuations that rely on gross profit margins. The following table was compiled from Palantir’s Q3 2021 10-Q and displays the reported cost of revenue and sales and marketing expense adjusted by removing the related stock-based compensation expense from each line item.
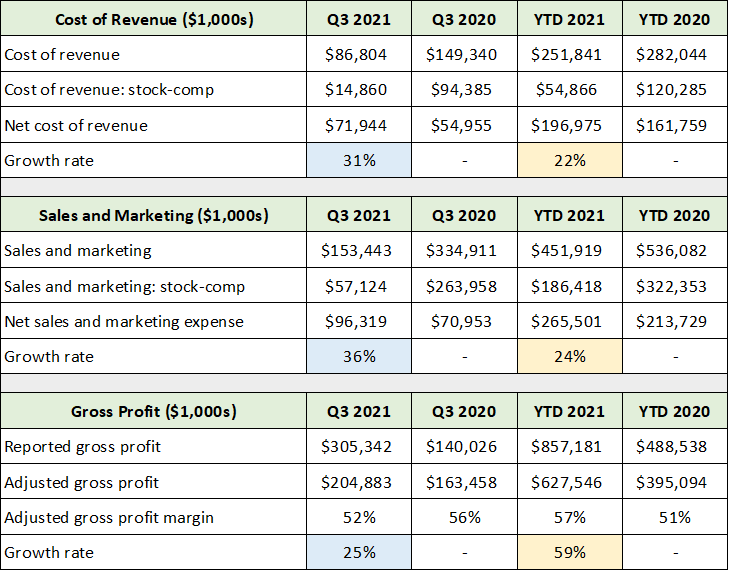
Source: Created by Brian Kapp, stoxdox
Notice that the adjusted gross profit growth has slowed considerably to 25% in Q3 (highlighted in blue in the lower portion of the table) compared to 59% through the first nine months of 2021 (highlighted in yellow). The cost of sales is rising rapidly in Q3 2021 compared to the first nine months of the year.
Palantir utilizes one KPI or Key Performance Indicator to judge performance and inform decision-making, which is referred to as Contribution Margin. It is similar to my adjusted gross margin figure above as can be seen in the following table compiled from Palantir’s Q3 2021 10-Q.
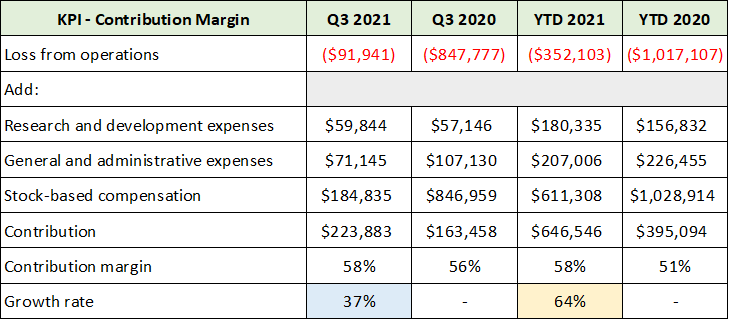
Source: Created by Brian Kapp, stoxdox
Notice that the contribution row is remarkably similar to my adjusted gross profit row in the previous table. Additionally, the growth rate deceleration is similar, as can be seen in the highlighted cells. While 37% is materially different from my estimate of 25% growth, the step change lower from 64% is of similar amplitude.
Operating Income
Turning to operating income, I have adjusted the reported figures once again by removing stock option-related expenses as well as one-off expenses pertaining to the direct listing IPO in 2020. The overriding message is once again one of rapid deceleration. The following table was compiled from the same SEC filing and displays operating expenses excluding sales and marketing expenses, as well as my adjusted operating income estimate.
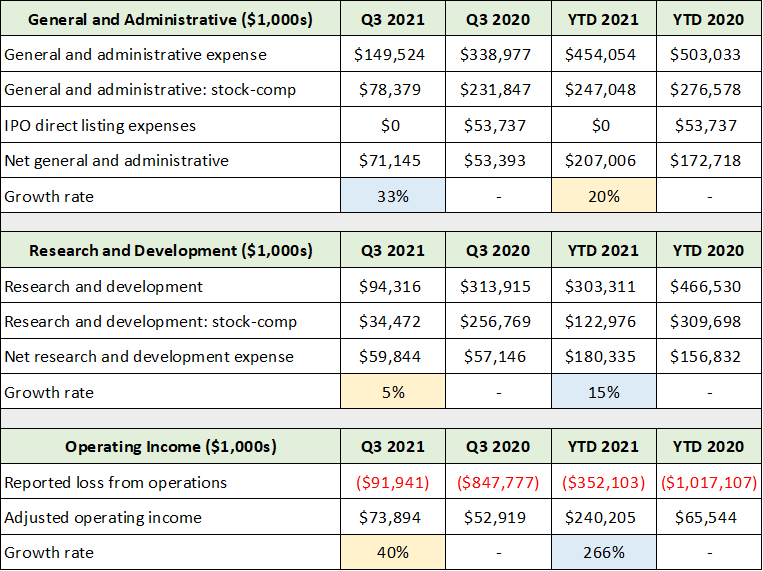
Source: Created by Brian Kapp, stoxdox
In the lower section of the table, notice the incredible deceleration in adjusted operating income to 40% growth in Q3 of 2021 compared to 266% growth through the first nine months of the year. General and administrative expenses accelerated rapidly in Q3 2021, while Palantir materially reduced research and development investment to just 5% growth in Q3.
The research and development investment slowdown could be a negative read through for sales growth as R&D is an integral part of the sales process. Research and development expenses should track the sales cycle through the three customer phases: Acquire, Expand, and Scale. As customer needs are identified by sales and marketing, research and development expenses should respond to increased future sales potential. This does not appear to be happening at the moment.
As of Q3 2021, Palantir is annualizing at an adjusted operating income run rate of approximately $300 to $320 million, or about $.16 per share. This is a before-tax operating income figure. The primary takeaway from the operating income front is that profitability is slowing rapidly. This provides additional color for the unusual Investee customer acquisition strategy being deployed.
Consensus Growth Estimates
If Palantir is producing at a $320 million adjusted annual operating income run rate and it was taxed at a normalized 25% rate, the current earnings power would be in the $240 million range or $.12 per diluted share. With this information and the growth deceleration outlined above, we can begin to put consensus earnings estimates into context. The following table was compiled from Seeking Alpha and displays consensus earnings and revenue estimates through 2023.
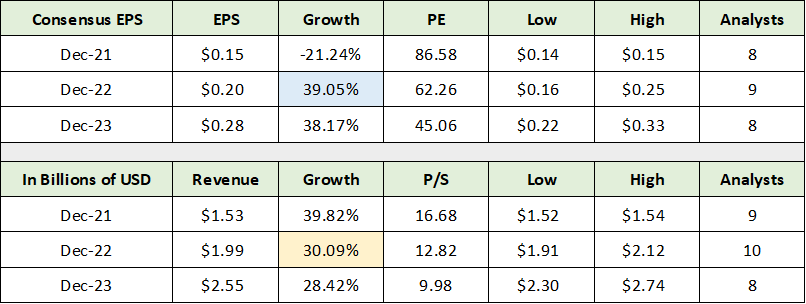
Source: Seeking Alpha. Created by Brian Kapp, stoxdox
I have highlighted the 2022 consensus estimates for earnings and sales growth. Notice that the 39% consensus earnings growth estimate for 2022 is in line with the 40% operating income growth posted in Q3 of 2021. Additionally, the sales growth estimate of 30% is just above the 29% adjusted sales growth in Q3 2021 excluding sales to Investees.
The 39% earnings growth expected for 2022 appears to be at material risk of being too high given the rapid slowdown in operating income to 40% in Q3 2021 compared to 266% through the first nine months of the year. This trajectory would likely place earnings growth for 2022 well below 39%.
The 30% sales growth estimate for 2022 looks to be achievable given Palantir’s aggressive investment strategy in regard to Investees who then purchase Palantir software. I believe the market will tend to discount Investee sales as I have. Excluding these sales, the revenue growth trajectory appears to be trending closer to 20% than 30% for 2022, which opens the door to further growth disappointment.
Looking to consensus estimates for 2023, the expected growth rates are remarkably similar to 2022. This straight-line growth forecast through 2023 adds to the risk that consensus estimates could be too high over the coming years. The current trajectory points to growth materially below that expected for 2022 and 2023.
Valuation
Palantir is trading at 87x the consensus earnings estimate for 2021 and 62x that for 2022. Please keep in mind that these are non-GAAP (generally accepted accounting principles) earnings estimates. On a GAAP basis, Palantir continues to produce at a loss. The reported loss in Q3 2021 was $92 million and was $352 million through the first nine months of 2021.
Using the non-GAAP earnings estimates, 87x current year earnings and 62x forward earnings are extreme valuations from a historical market perspective. That said, they are within the realm of possibility for a growth stock in recent years. When viewed against Palantir’s rapidly slowing sales and operating income growth rates, as well as the heightened risk that consensus estimates may be too high, the current valuation multiples on consensus estimates offer little margin for error.
On the sales front, Palantir is valued at 17x the consensus 2021 revenue estimate and 13x that for 2022. These are extreme price-to-sales multiples for a large-cap company from a historical perspective. My estimate of core sales growth trending toward 20% excluding Investee revenue suggests that these valuation multiples on sales also offer little margin for error.
The valuation risks are further elevated when combined with the rapidly slowing operating income growth. Furthermore, as can be seen in my adjusted gross margin figure growing at 25% as of Q3 2021, the Palantir business model may not be supportive of a historically extreme price-to-sales valuation.
Technicals
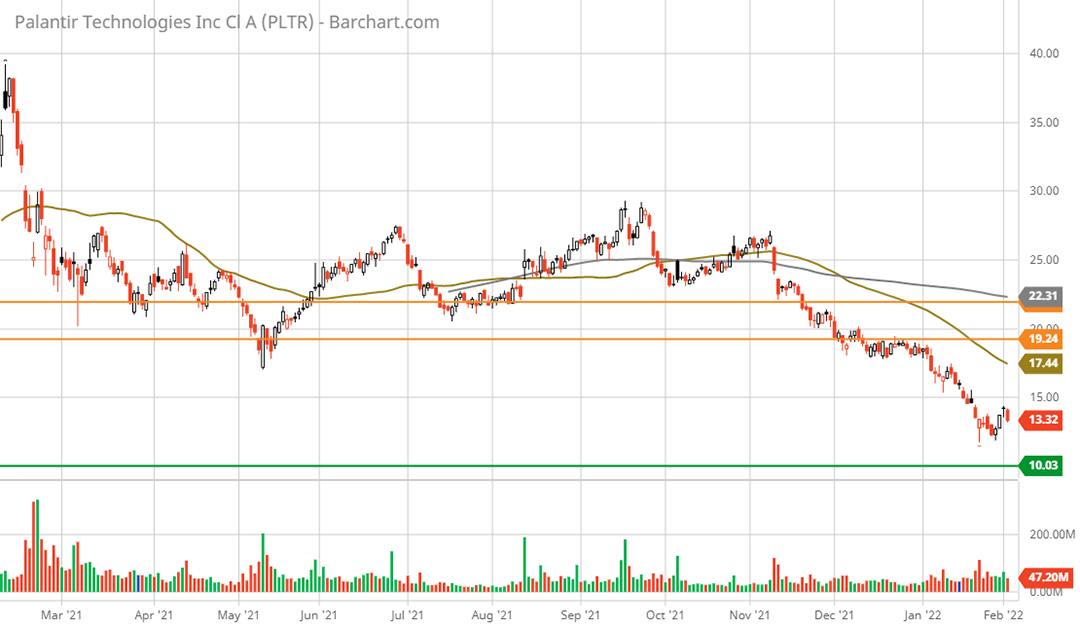
While the fundamental backdrop points toward little margin for error and subdued excess return potential, the technical setup suggests more meaningful upside return potential. The following 3-year weekly chart offers a bird’s eye view of the potential technical return spectrum. I have highlighted the key resistance levels with orange horizontal lines and the primary support level with a green line.
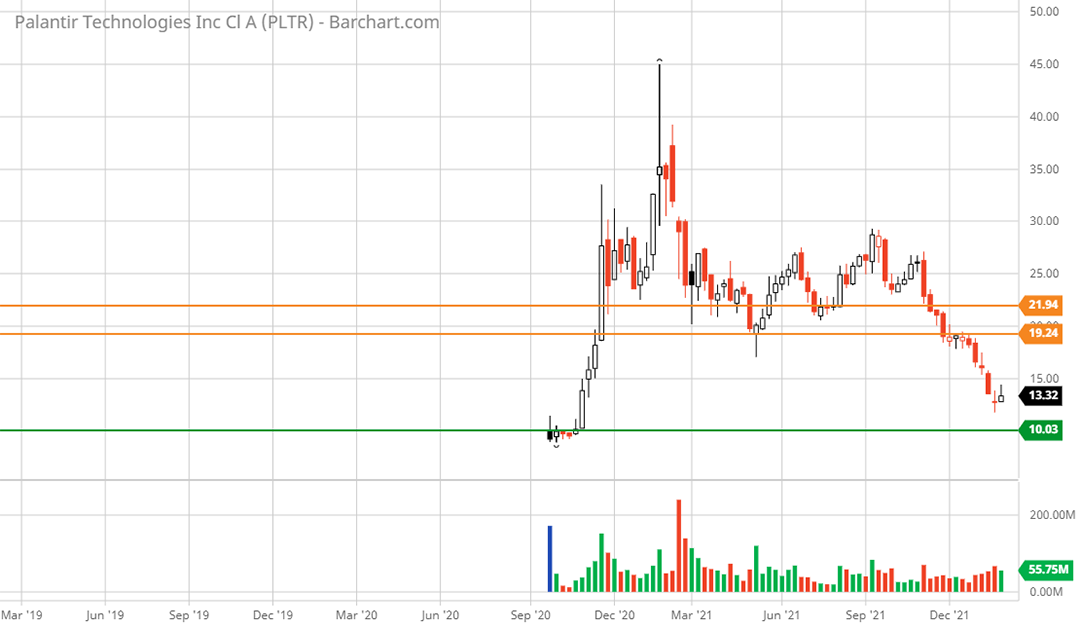
Palantir 3-year weekly chart. Created by Brian Kapp using a chart from Barchart.com
The return potential to the nearest resistance levels of $19 and $22 is 43% and 65%, respectively. On the downside, the nearest support lies at the IPO price range near $10. The downside return potential to this level is -25%. It should be noted that Palantir’s short trading history of 16 months limits the usefulness of technical analysis. Additionally, with no trading history beneath the IPO price, it is unclear where support will be found if the $10 level is breached to the downside.
To estimate downside potential beneath $10, I apply an earnings multiple of 40x the 2022 non-GAAP consensus earnings estimate. This valuation is twice that of the current market averages and would place Palantir shares at $8. This represents -40% downside risk from current levels.
If the 39% consensus earnings estimate for 2022 is too high, further downside from $8 is in the realm of possibility. To estimate the downside risk potential if estimates are too high, I apply the same 40x non-GAAP earnings to my estimate of Palantir’s current annual run rate for fully-taxed, non-GAAP profitability. If earnings growth comes in at 25% for 2022 (my estimate of adjusted gross profit growth as of Q3 2021) on top of my estimate of $.12 for the current annual run rate of adjusted earnings after tax, the shares could trade down to $6. This would represent downside risk of -55%.
The following daily chart provides a closer look at the technical backdrop.
Palantir 1-year daily chart. Created by Brian Kapp using a chart from Barchart.com
The technical picture suggests heavy resistance between $19 and $22. Given the unrelenting downtrend over the past three months, a near-term bounce is likely. That said, the upside technical potential combined with the downside fundamental potential leaves the shares with a balanced potential return spectrum of 65% to -55% over the near term.
Summary
All told, Palantir should be placed on the watchlist for high-risk growth investors. The long-term opportunity lies in becoming a foundational enterprise operating system capable of integrating structured and unstructured data for real-time intelligence. However, with notable red flags in the mix, caution is in order. The primary red flags include slowing sales, an unusual go-to-market shift, rapidly decelerating profitability, and an elevated valuation which offers limited margin for error. The resulting symmetry between risk and reward results in a neutral rating.
Price as of report date 2-3-22: $12.45
Palantir Investor Relations Website: Palantir Investor Relations